. 2009 Jan;33(1):19-30.
doi: 10.1016/j.cellbi.2008.10.015. Epub 2008 Nov 1.

Critical role of PBEF expression in pulmonary cell inflammation and permeability

Affiliations

Critical role of PBEF expression in pulmonary cell inflammation and permeability

Peng Liu et al. Cell Biol Int. 2009 Jan.

Abstract

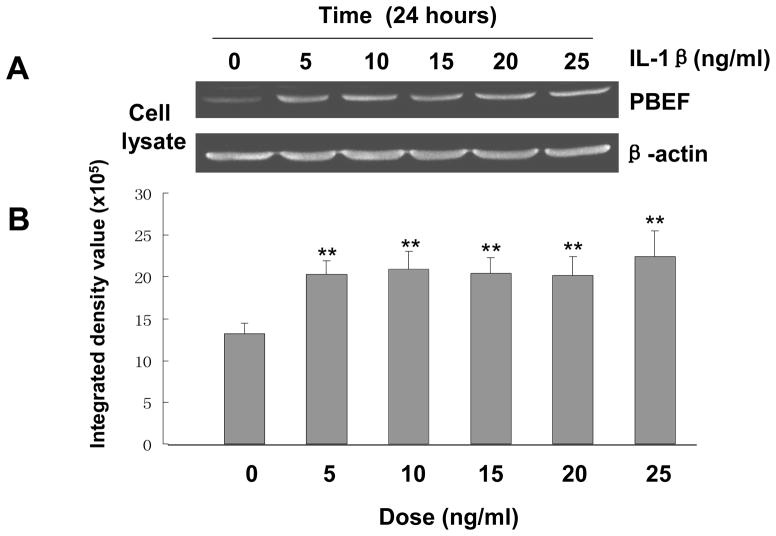
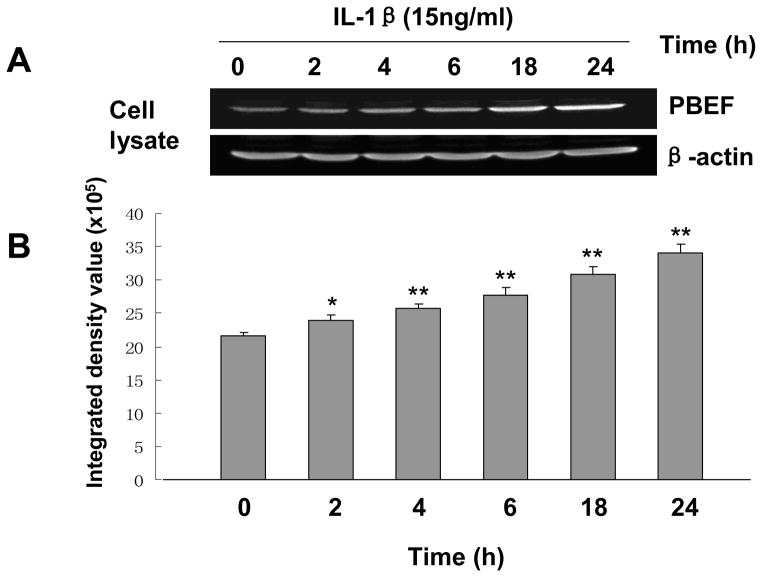
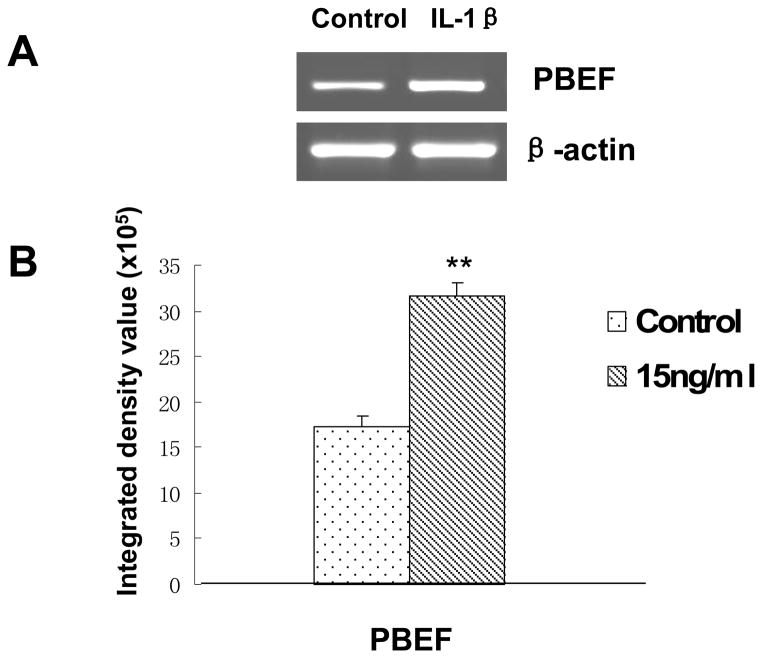
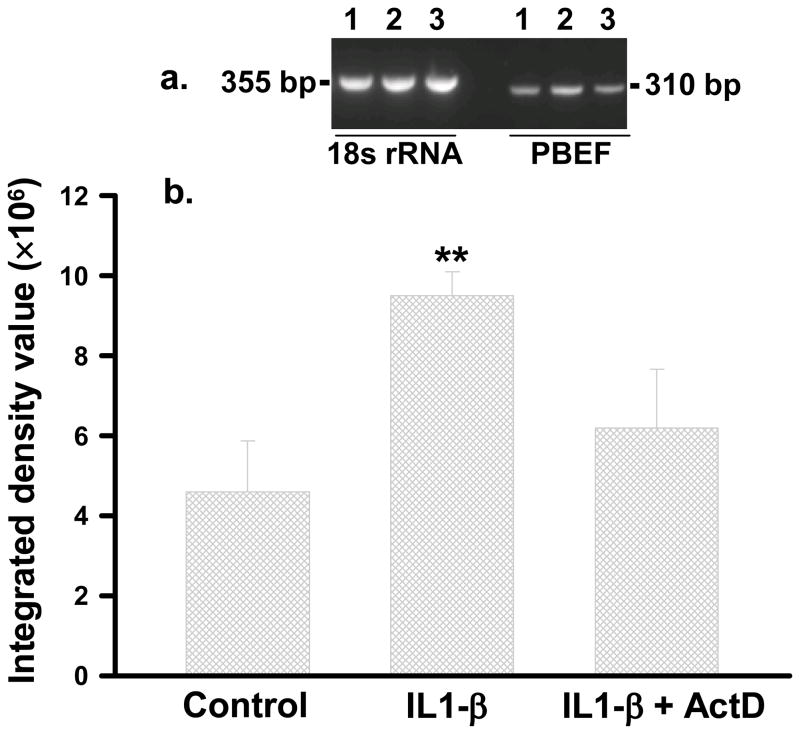
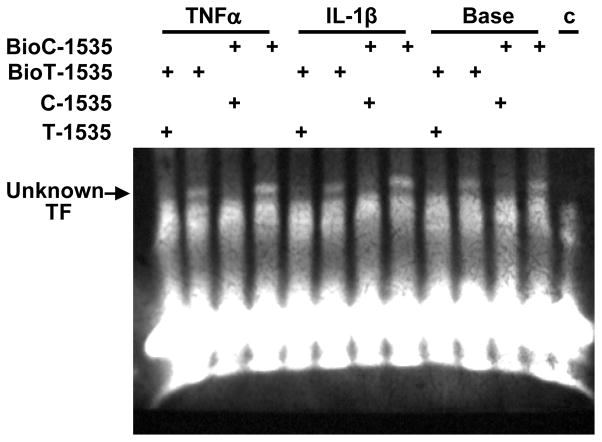
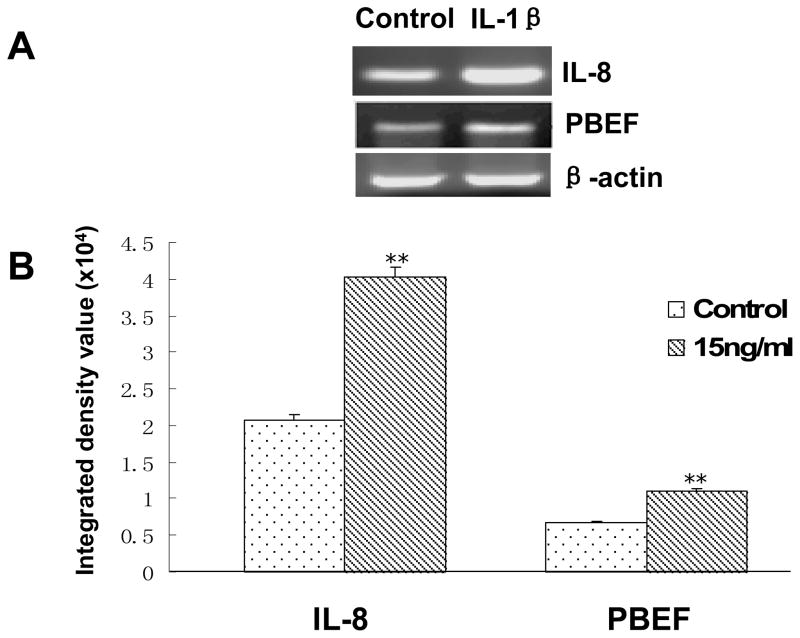
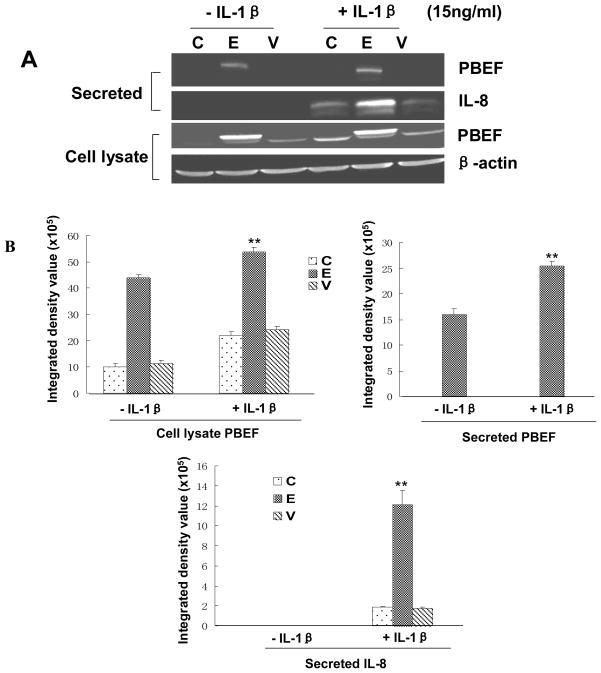
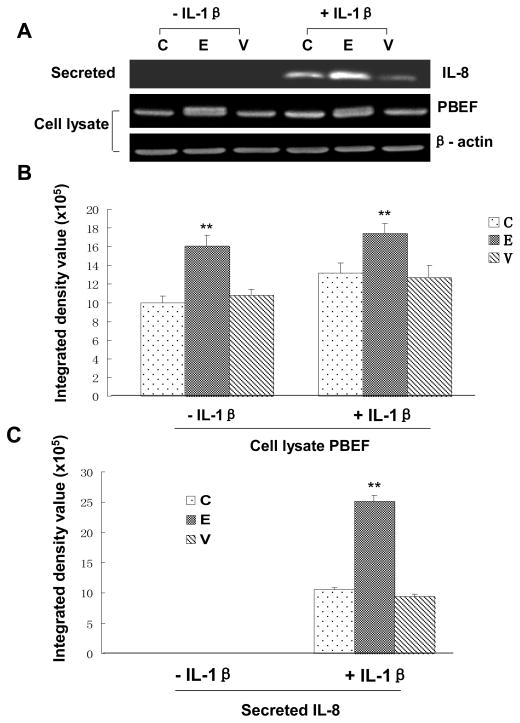
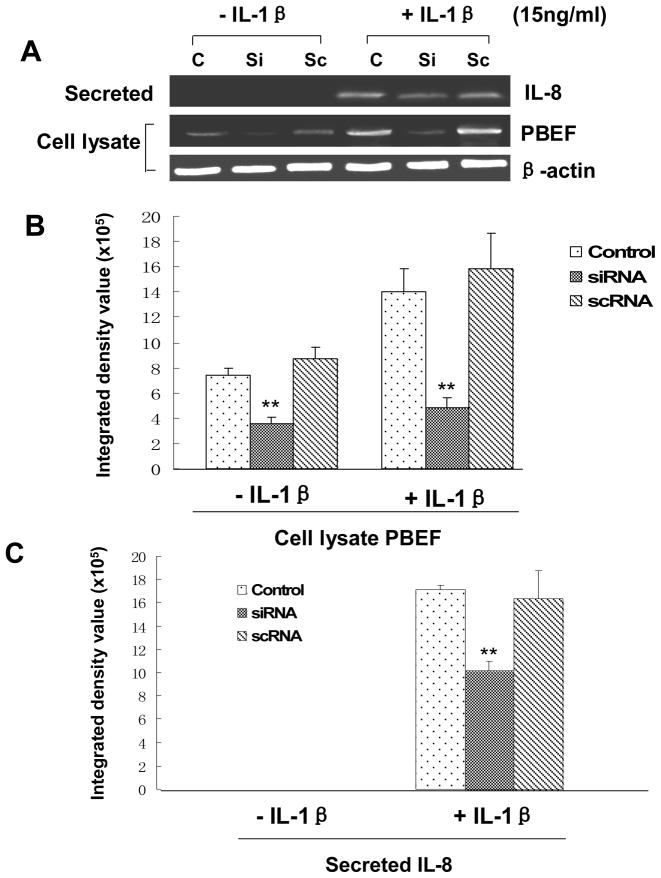
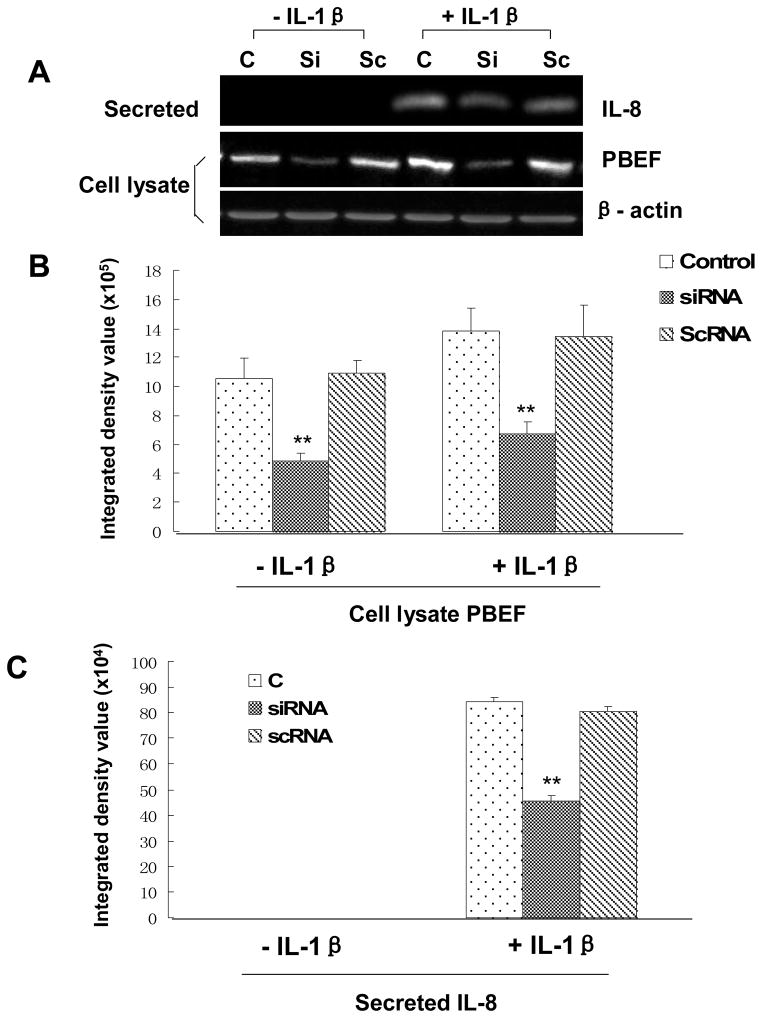
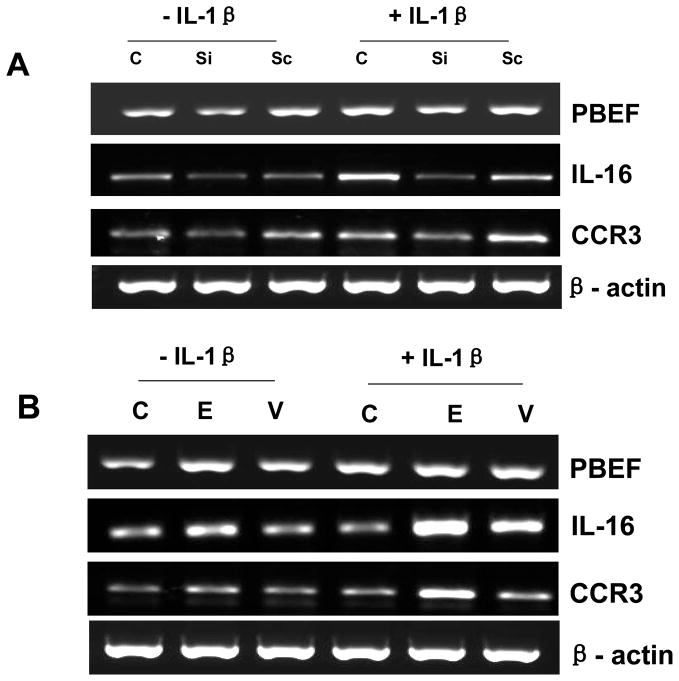
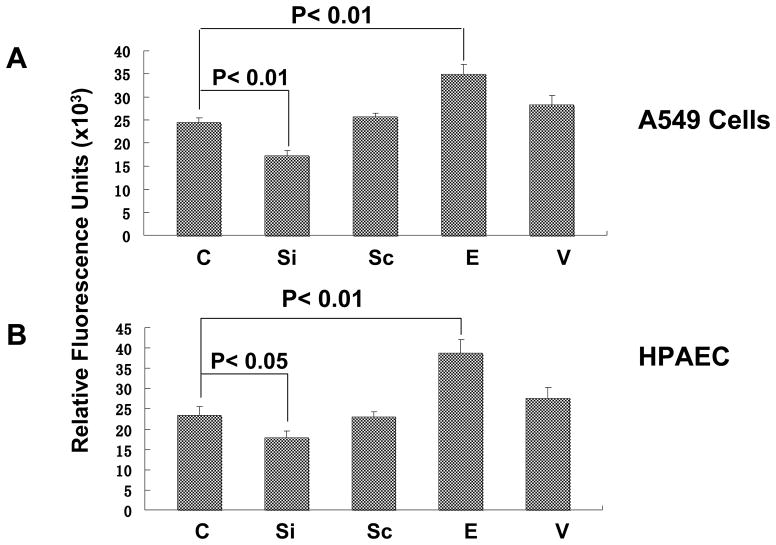
Previous studies in our lab have identified pre-B-cell colony enhancing factor (PBEF) as a novel biomarker in acute lung injury. This study continues to elucidate the underlying molecular mechanism of PBEF in the pathogenesis of acute lung injury in pulmonary cell culture models. Our results revealed that IL-1beta induced PBEF expression in pulmonary vascular endothelial cells at the transcriptional level and a -1535 T-variant in the human PBEF gene promoter significantly attenuated its binding to an IL-1beta-induced unknown transcription factor. This may underlie the reduced expression of PBEF and thus the lower susceptibility to acute lung injury in -1535T carriers. Furthermore, overexpression of PBEF significantly augmented IL-8 secretion and mRNA expression by more than 6-fold and 2-fold in A549 cells and HPAEC, respectively. It also significantly augmented IL-1beta-mediated cell permeability by 44% in A549 cells and 65% in endothelial cells. The knockdown of PBEF expression significantly inhibited IL-1beta-stimulated IL-8 secretion and mRNA level by 60% and 70%, respectively, and the knockdown of PBEF expression also significantly attenuated IL-1beta-induced cell permeability by 29% in epithelial cells and 24% in endothelial cells. PBEF expression also affected the expression of two other inflammatory cytokines (IL-16 and CCR3 genes). These results suggest that PBEF is critically involved in pulmonary vascular and epithelial inflammation and permeability, which are hallmark features in the pathogenesis of acute lung injury. This study lends further support to our finding that PBEF is a potential new target in acute lung injury.


Figures

Fig. 1
Fig. 1
Dose-response of IL-1β induced PBEF protein expression in A549 cells. A. A representative western blotting image of PBEF and β-actin protein detections. After starving for serum overnight, A549 cells were stimulated with different doses of IL-1β, as indicated, for 24 hours. Equal amount of total cell lysate protein from each sample was separated by 16.5% SDS-PAGE and immunodetected by western blotting using anti-human PBEF or β-actin antibodies. Protein band images on the western blotting were acquired using the Alpha Imager (Alpha Innotech Corp., San Leandro, CA). The displayed image is one of three replicate samples and is typical of those obtained. B. Quantitation of cell lysate PBEF protein level by densitometry analysis. The protein band intensity on the western blotting was analyzed by the AlphaEase Stand Alone software (Alpha Innotech Corp., San Leandro, CA). The integrated density value of each band was used as a measure of the protein level. Results from each group are presented as mean ± SD of 3 samples. Statistical comparative analyses of PBEF levels between the control (IL-1β, 0 ng/ml) and different treatment groups (IL-1β, 5–25 ng/ml) were performed using the unpaired t test. **, p<0.01.
Fig. 2
Fig. 2
Time-course of IL-1β induced PBEF protein expression in A549 cells. A. A representative western blotting image of PBEF and β-actin protein detections. After starving for serum overnight, A549 cells were stimulated with IL-1β (15 ng/ml) at different time points (h) as indicated. Equal amount of total cell lysate protein from each sample was separated by 16.5% SDS-PAGE and immunodetected by the western blotting using anti-human PBEF or β-actin antibodies. β-actin was used as a house-keeping gene and loading control. Protein band images on the western blotting were acquired using the Alpha Imager (Alpha Innotech Corp., San Leandro, CA). The displayed image is one of three replicate samples and is typical of those obtained. B. Quantitation of cell lysate PBEF protein level by densitometry analysis. Cell lysate PBEF protein levels were quantified by densitometry analyses in the same way as described above in Figure 1. *, p<0.05; **, p<0.01.
Fig. 3
Fig. 3
Effects of IL-1β treatment on the mRNA expression of PBEF in A549 cells. A. A representative gel image of PBEF and β-actin mRNA detections. After starving for serum overnight, A549 cells were stimulated with IL-1β (15 ng/ml) for 4 h. Total cell RNA was reverse-transcribed, amplified by PCR using the gene specific primers (Table 1), separated by 1.5% agarose electrophoresis and visualized with ethidium bromide. The gel image was captured using the Alpha Imager (Alpha Innotech Corp., San Leandro, CA). β-actin was used as a house-keeping gene control. The displayed image is one of three replicate samples and is typical of those obtained. B. Quantitation of PBEF mRNA levels by densitometry analysis. The mRNA band intensity on the gel image was analyzed by the AlphaEase Stand Alone software (Alpha Innotech Corp., San Leandro, CA). The integrative density value of each band was used as a measure of the mRNA level. Results from each group are presented as mean ± SD of 3 samples. Statistical comparative analyses of PBEF mRNA levels between the control and IL-1β treated group were performed using the unpaired t-test.;**, p<0.01.
Fig. 4
Fig. 4
RT-PCR semi-quantification of PBEF mRNA in HPAEC treated without or with either IL1-β or IL1-β + Act D. HPAEC were treated without or with either IL1-β (10 ng/ml) or IL1-β + Act D (5μg/ml). Total RNA was reverse-transcribed, amplified by PCR using gene specific primers, separated on 2% agarose electrophoresis, analyzed by an Alpha Innotech densitometer. a, A representative image. 1-control; 2-IL1-β; 3- IL1-β +Act D; b, Densitometry analyses. **, p<0.01.
Fig. 5
Fig. 5
Electrophoretic Mobility Shift Assay on -1535C and -1535 T Binding to an unknown Transcription Factor (TF). HPAEC were treated without (Base) or with either IL-1β (10ng/ml) or TNFα (10 ng/ml) for 4 h. 10 μg nuclear extract protein in each sample was incubated with either biotin labeled c-1535 (Bio C-1535) or BioT-1535 oligo in the absence or presence of their unlabeled 200 fold excess counterparts. The bindings were visualized by a chemiluminecence. C, no oligo control.
Fig. 6
Fig. 6
Effects of the IL-1β stimulation on IL-8 & PBEF mRNA expressions in HPAEC. A. A representative gel image of IL-8, PBEF and β-actin mRNA detections. After starving for serum overnight, HPAEC were stimulated with IL-1β(15 ng/ml) for 4 h. Total cell RNA was reverse-transcribed, amplified by PCR using the gene specific primers (Table 1), separated by 1.5% agarose electrophoresis and visualized with ethidium bromide. The gel image was captured using the Alpha Imager (Alpha Innotech Corp., San Leandro, CA). β-actin was used as a house-keeping gene control. The displayed image is one of four replicate samples and is typical of those obtained. B. Quantitation of IL-8 and PBEF mRNA levels by the densitometry analysis. The mRNA band intensity on the gel image was analyzed by the AlphaEase Stand Alone software (Alpha Innotech Corp., San Leandro, CA). The integrative density value of each band was used as a measure of the mRNA level. Results from each group are presented as mean ± SD of 4 samples from two separate experiments. Statistical comparative analyses of IL-8 and PBEF mRNA levels between the control and IL-1β treated group were performed using the unpaired t test. **, p<0.01.
Fig. 7
Fig. 7
Effects of PBEF overexpression on IL-8 secretion in A549 cells. A. A representative western blotting image of IL-8, PBEF and β-actin protein detections. After starving for serum overnight, A549 cells were transfected with the vehicle control (C), pCAGGS-mPBEF vector (E), or pCAGGS vector (V) for 48 hours before subjected to the treatment without or with IL-1β (15 ng/ml) for 24 hours. Secreted IL-8 and PBEF, cell lysate PBEF and β-actin protein were immunodetected as described in Figure 1. B. Quantitation of cell lysate and secreted PBEF as well as secreted IL-8 levels protein levels by the densitometry analysis. Cell lysate & secreted PBEF and IL-8 protein levels in both control and PBEF overexpressing groups were quantified by densitometry analyses in the same way as described above in Figure 1.**, p<0.01.
Fig. 8
Fig. 8
Effects of PBEF overexpression on IL-8 secretion in HPAEC. A. A representative western blotting image of IL-8, PBEF and β-actin protein detections. HPAEC were treated n the same way as those in A549 cells as described above in Figure 5. Secreted IL-8, cell lysate PBEF and β-actin protein were immunodetected in the same way as described above in Figure 1. B. Quantitation of cell lysate PBEF protein levels by densitometry analysis. C. Quantitation of secreted IL-8 levels by densitometry analysis. Secreted IL-8 and cell lysate PBEF protein levels were quantified by densitometry analyses in the same way as those in A549 cells as described above in Figure 5. **, p<0.01.
Fig. 9
Fig. 9
Effects of PBEF knock down on IL-8 secretion in A549 cells. A. A representative western blotting image of IL-8, PBEF and β-actin protein detections. After starving for serum overnight, A549 cells were transfected with the vehicle control (C), scrambled siRNA (Sc), or PBEF stealth siRNA (Si) for 48 h before subjected to treatment without or with IL-1β (15 ng/ml) for 24 hours. Secreted IL-8, cell lysate PBEF and β-actin protein were immunodetected as described in Figure 1 B. Quantitation of cell lysate PBEF protein levels by densitometry analysis. C. Quantitation of secreted IL-8 levels by densitometry analysis. Cell lysate PBEF and secreted IL-8 protein levels in various treatments of A549 cells were quantified by densitometry analyses in the same way as described above in Figure 1.**, p<0.01.
Fig. 10
Fig. 10
Effects of PBEF knock down on IL-8 secretion in HPAEC. A. A representative western blotting image of IL-8, PBEF and β-actin protein detections. HPAEC were treated in the same way as those in A549 cells as described above in Figure 7. Secreted IL-8, cell lysate PBEF and β-actin protein were immunodetected in the same way as described above in Figure 1. B. Quantitation of cell lysate PBEF protein levels by densitometry analysis. C. Quantitation of secreted IL-8 levels by densitometry analysis. Secreted IL-8 and cell lysate PBEF protein levels were quantified by densitometry analyses in the same way as those in A549 cells as described above in Figure 7. **, p<0.01.
Fig. 11
Fig. 11
RT-PCR analyses of PBEF, IL-16, CCR3 and β-actin mRNA levels in A549 cells. A549 cells were grown and transfected with the vehicle control (C), PBEF stealth siRNA (Si), scrambled siRNA (Sc), pCAGGS-mPBEF vector (E), or pCAGGS vector (V) for 48 h before subjected to the treatment without or with IL-1β(15 ng/ml) for 4 hours. Total cell RNA was reverse-transcribed, amplified by PCR using the gene specific primers (Table 1), separated by 1.5 % agarose electrophoresis and visualized with ethidium bromide. A. A representative RT-PCR gel image of PBEF, IL-16, CCR3 and β-actin mRNA detections in PBEF-knockdown A549 cells. B. A representative RT-PCR gel image of PBEF, IL-16, CCR3 and β-actin mRNA detections in PBEF-overexpression A549 cells.
Fig. 12
Fig. 12
Effects of PBEF expression on in vitro cell permeability of A549 cells and HPAEC. A549 cells or HPAEC were transfected with the vehicle control (C), PBEF stealth siRNA (Si), scrambled siRNA (Sc), pCAGGS-mPBEF vector (E), or pCAGGS vector (V) for 48 h and then seeded onto the culture inserts of permeability assay chambers. The cells were then subjected to the treatment with 15 ng/ml IL-1β for 18 hours. Then, FITC-Dextran was added to each insert for 5 min at room temperature. FITC-Dextran leaking out into the bottom chamber was assayed using a fluorometer. Relative fluorescence units in each group were used as an indicator of cell permeability. A. Effects of PBEF expression on IL-1β-mediated increase of in vitro cell permeability of A549. B. Effects of PBEF expression on IL-1β-mediated increase of in vitro cell permeability of HPAEC. *P < 0.05, **P < 0.01.

Similar articles

Cited by

References

    1. Adams JM, Hauser CJ, Livingston DH, Lavery RF, Fekete Z, Deitch EA. Early trauma polymorphonuclear neutrophil responses to chemokines are associated with development of sepsis, pneumonia, and organ failure. J Trauma. 2001;51:452–456. - PubMed
    1. Bachofen M, Weibel ER. Alterations of the gas exchange apparatus in adult respiratory insufficiency associated with septicemia. Am Rev Respir Dis. 1977;116:589–615. - PubMed
    1. Bachofen M, Weibel ER. Structural alterations of lung parenchyma in the adult respiratory distress syndrome. Clin Chest Med. 1982;3:35–56. - PubMed
    1. Bajwa EK, Yu C, Gong MN, Thompson BT, Christiani DC. PBEF gene polymorphisms influence the risk of developing ARDS. Am J Respir Crit Care Med. 2006;3:A272.
    1. Bradford MM. A rapid and sensitive method for the quantitation of microgram quantities of protein utilizing the principle of protein-dye binding. Anal Biochem. 1976;72(7):248–254. - PubMed

Publication types

MeSH terms