

Lipidomics analysis of essential fatty acids in macrophages
- PMID: 18996688
- PMCID: PMC2643973
- DOI: 10.1016/j.plefa.2008.09.021
Lipidomics analysis of essential fatty acids in macrophages
Abstract
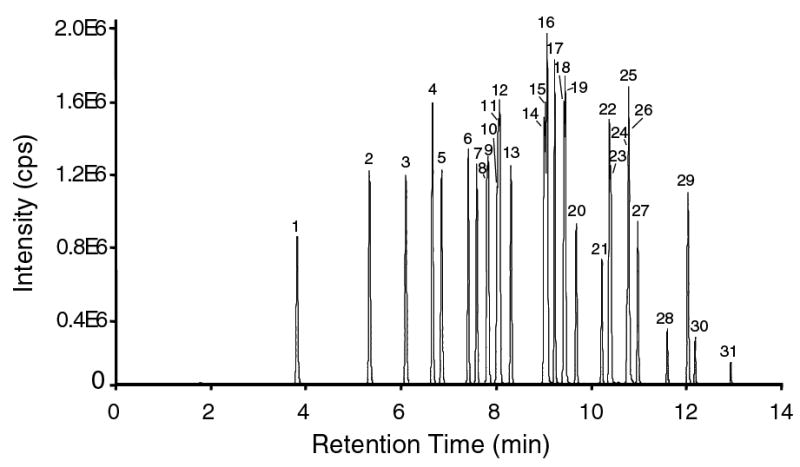
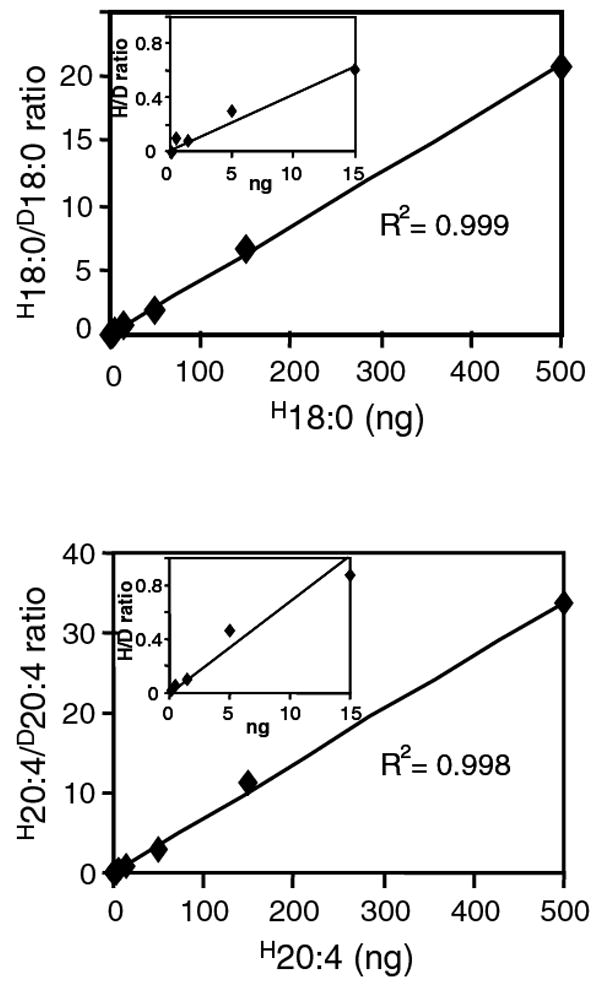
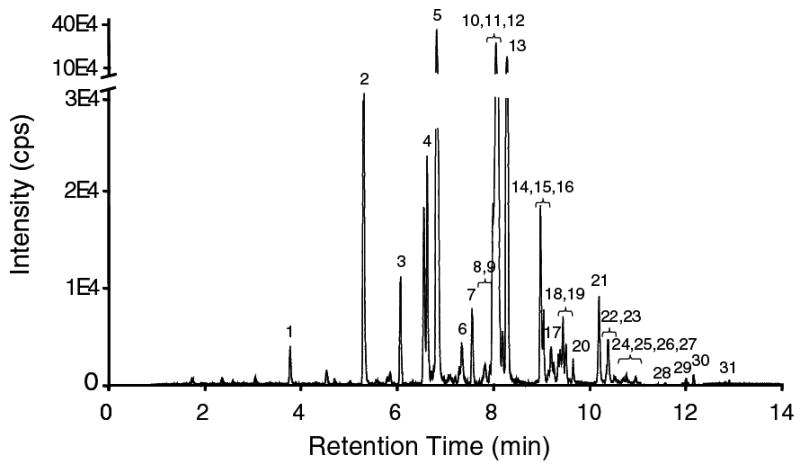
The Lipid Metabolites and Pathway Strategy (LIPID MAPS) Consortium is a nationwide initiative that has taken on the task of employing lipidomics to advance our understanding of lipid metabolism at the molecular and mechanistic level in living organisms. An important step toward this goal is to craft enabling analytical procedures to comprehensively measure all lipid species, to establish the precise structural identity of the lipid molecules analyzed, and to generate accurate quantitative information. The LIPID MAPS Consortium has succeeded in the implementation of a complete infrastructure that now provides tools for analysis of the global lipidome in cultured and primary cells. Here we illustrate the advancement of a gas chromatography mass spectrometry (GC/MS) procedure for the analysis of essential fatty acids in RAW 264.7 cells. Our method allows for the specific identification and quantification of over 30 fatty acids present in cells in their free form in a single analytical GC/MS run. Free fatty acids are selectively extracted in the presence of deuterated internal standards, which permit subsequent estimation of extraction efficiencies and quantification with high accuracy. Mass spectrometer conditions were optimized for single-ion monitoring, which provides an extremely sensitive technology to measure fatty acids from biological samples in trace amounts. These methods will be presented in the context of our broader effort to analyze all fatty acids as well as their metabolites in inflammatory cells.
Figures
Similar articles
-
High sensitivity quantitative lipidomics analysis of fatty acids in biological samples by gas chromatography-mass spectrometry.Biochim Biophys Acta. 2011 Nov;1811(11):648-56. doi: 10.1016/j.bbalip.2011.07.006. Epub 2011 Jul 20. Biochim Biophys Acta. 2011. PMID: 21787881 Free PMC article.
-
Lipidomics for Determining Giant Panda Responses in Serum and Feces Following Exposure to Different Amount of Bamboo Shoot Consumption: A First Step towards Lipidomic Atlas of Bamboo, Giant Panda Serum and Feces by Means of GC-MS and UHPLC-HRMS/MS.Int J Mol Sci. 2022 Sep 29;23(19):11544. doi: 10.3390/ijms231911544. Int J Mol Sci. 2022. PMID: 36232846 Free PMC article.
-
Analysis of non-esterified fatty acids in human samples by solid-phase-extraction and gas chromatography/mass spectrometry.J Chromatogr B Analyt Technol Biomed Life Sci. 2013 Nov 1;938:22-6. doi: 10.1016/j.jchromb.2013.08.016. Epub 2013 Aug 16. J Chromatogr B Analyt Technol Biomed Life Sci. 2013. PMID: 24036177
-
Enabling High Structural Specificity to Lipidomics by Coupling Photochemical Derivatization with Tandem Mass Spectrometry.Acc Chem Res. 2021 Oct 19;54(20):3873-3882. doi: 10.1021/acs.accounts.1c00419. Epub 2021 Sep 27. Acc Chem Res. 2021. PMID: 34570464 Review.
-
Recent Analytical Methodologies in Lipid Analysis.Int J Mol Sci. 2024 Feb 13;25(4):2249. doi: 10.3390/ijms25042249. Int J Mol Sci. 2024. PMID: 38396926 Free PMC article. Review.
Cited by
-
Knockdown of delta-5-desaturase promotes the anti-cancer activity of dihomo-γ-linolenic acid and enhances the efficacy of chemotherapy in colon cancer cells expressing COX-2.Free Radic Biol Med. 2016 Jul;96:67-77. doi: 10.1016/j.freeradbiomed.2016.04.016. Epub 2016 Apr 19. Free Radic Biol Med. 2016. PMID: 27101738 Free PMC article.
-
Oxidized Products of Omega-6 and Omega-3 Long Chain Fatty Acids Are Associated with Increased White Matter Hyperintensity and Poorer Executive Function Performance in a Cohort of Cognitively Normal Hypertensive Older Adults.J Alzheimers Dis. 2020;74(1):65-77. doi: 10.3233/JAD-191197. J Alzheimers Dis. 2020. PMID: 32176647 Free PMC article.
-
Elemental, fatty acid, and protein composition of appendicoliths.Sci Rep. 2022 Nov 17;12(1):19764. doi: 10.1038/s41598-022-21397-9. Sci Rep. 2022. PMID: 36396724 Free PMC article.
-
Lipoprotein lipase regulates hematopoietic stem progenitor cell maintenance through DHA supply.Nat Commun. 2018 Apr 3;9(1):1310. doi: 10.1038/s41467-018-03775-y. Nat Commun. 2018. PMID: 29615667 Free PMC article.
-
Peroxisome proliferator-activated receptor-α accelerates α-chlorofatty acid catabolism.J Lipid Res. 2017 Feb;58(2):317-324. doi: 10.1194/jlr.M069740. Epub 2016 Dec 22. J Lipid Res. 2017. PMID: 28007964 Free PMC article.
References
-
- Schaloske RH, Dennis EA. The phospholipase A2 superfamily and its group numbering system. Biochim Biophys Acta. 2006;1761:1246–1259. - PubMed
-
- Engelman JA, Luo J, Cantley LC. The evolution of phosphatidylinositol 3-kinases as regulators of growth and metabolism. Nat Rev Genet. 2006;7:606–619. - PubMed
-
- Rocca B, FitzGerald GA. Cyclooxygenases and prostaglandins: shaping up the immune response. Int Immunopharmacol. 2002;2:603–630. - PubMed
-
- Schmelzer K, Fahy E, Subramaniam S, Dennis EA. The lipid maps initiative in lipidomics. Methods Enzymol. 2007;432:171–183. - PubMed
Publication types
MeSH terms
Substances
Grants and funding
LinkOut - more resources
Full Text Sources
Miscellaneous
