. 2009 Jan;19(1):1-11.
doi: 10.1101/gr.083931.108. Epub 2008 Nov 7.

Allele-specific gene expression patterns in primary leukemic cells reveal regulation of gene expression by CpG site methylation

Affiliations

Allele-specific gene expression patterns in primary leukemic cells reveal regulation of gene expression by CpG site methylation

Lili Milani et al. Genome Res. 2009 Jan.

Abstract

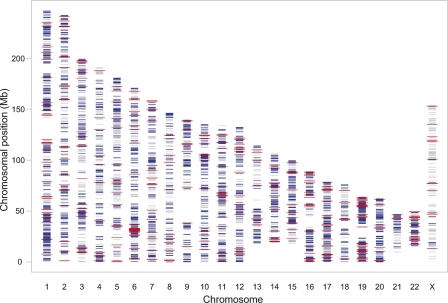
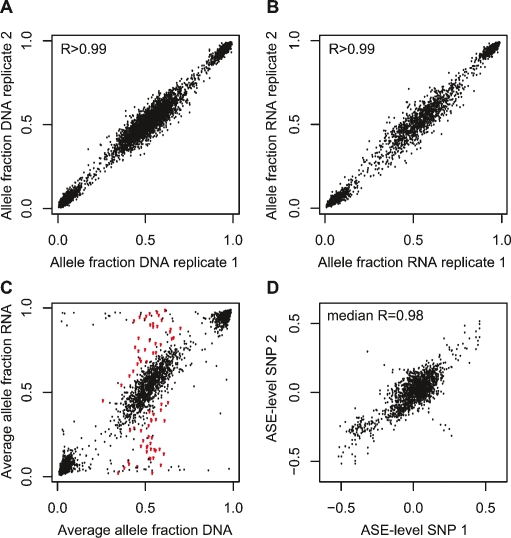
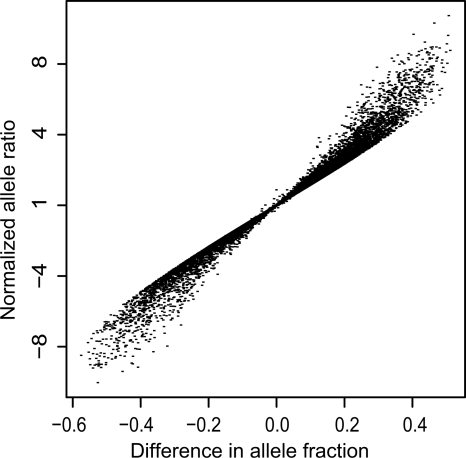
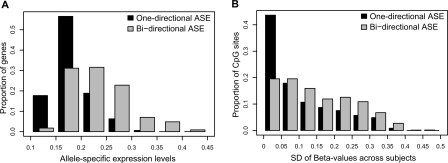
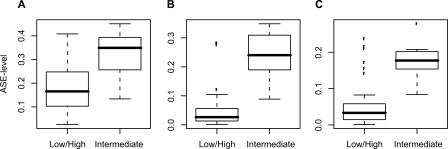
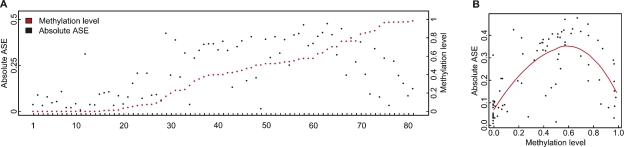
To identify genes that are regulated by cis-acting functional elements in acute lymphoblastic leukemia (ALL) we determined the allele-specific expression (ASE) levels of 2, 529 genes by genotyping a genome-wide panel of single nucleotide polymorphisms in RNA and DNA from bone marrow and blood samples of 197 children with ALL. Using a reproducible, quantitative genotyping method and stringent criteria for scoring ASE, we found that 16% of the analyzed genes display ASE in multiple ALL cell samples. For most of the genes, the level of ASE varied largely between the samples, from 1.4-fold overexpression of one allele to apparent monoallelic expression. For genes exhibiting ASE, 55% displayed bidirectional ASE in which overexpression of either of the two SNP alleles occurred. For bidirectional ASE we also observed overall higher levels of ASE and correlation with the methylation level of these sites. Our results demonstrate that CpG site methylation is one of the factors that regulates gene expression in ALL cells.


Figures

Figure 1.
Figure 1.
Genome-wide distribution of 8000 genes included on the NS-12 BeadChips (gray), 2529 genes, which contained heterozygous SNPs and were expressed in the ALL cell samples included in the study (blue), and 400 genes for which we detected allele-specific gene expression (red). The chromosome numbers are given on the x-axis and the chromosomal positions (Mb) on the y-axis.
Figure 2.
Figure 2.
Genotyping by the NS-12 BeadChips to detect allele-specific gene expression. (A) Correlation between the allele fractions determined in replicate DNA samples for 3531 expressed SNPs in one ALL sample. The median correlation between the allele fraction obtained in replicate assays in all 197 samples was 0.9969 (range 0.9934–0.9986). (B) Correlation between the allele fractions determined by genotyping the same 3531 SNPs in replicate RNA samples from the same sample as in A. The median correlation between the allele fraction obtained in replicate assays in all 197 samples was 0.9956 (range 0.9779–0.9984). (C) Average allele fractions from triplicate assays of 3531 SNPs in RNA and DNA from the same sample as above. The red dots represent the allele fraction in RNA for SNPs that display allele-specific expression, i.e., SNPs that are heterozygous in DNA and show a significant difference (P < 0.001) in the mean allele fraction between RNA and DNA from the same cell sample as in A and B. (D) Pairwise correlation between allele-specific expression (ASE) levels determined using pairs of informative SNPs located in the same exon of 16 different genes. The ASE level for each SNP is given as the average difference in allele fraction between triplicate DNA and triplicate RNA samples. Shown are the results from 16 genes, of which 11 genes had two SNPs in the same exon, two genes had three SNPs in the same exon, and three genes had more than three SNPs in the same exon and were heterozygous in 9–112 samples, totaling 1658 observations. The pairwise correlation between ASE-levels determined with these SNPs ranged from 0.68 to 0.99 (median 0.98), with the exception of three SNPs in the FPR1 gene, between which there was an obvious inverse correlation between the ASE levels in a subset of the samples. As can be seen in Supplemental Figure 2 these SNPs are located outside the main linkage disequilibrium (LD) block of the FPR1 gene.
Figure 3.
Figure 3.
Correlation between ASE determined using allele fractions and normalized allele ratios. The ASE levels determined according to the difference in allele fraction [A1/(A1 + A2)] between SNPs in RNA and DNA are shown on the x-axis. The fold overexpression of one allele according to the allele ratios (A1/A2) for SNPs in RNA normalized against the allele ratio for SNPs in DNA are shown on the y-axis. Mean values from triplicate assays of 3531 informative SNPs in 197 ALL samples are shown (∼700,000 data points).
Figure 4.
Figure 4.
Variation of ASE and CpG site methylation levels in genes with one-directional and bidirectional ASE. (A) Bins of average absolute values for allele-specific expression of all genes (n = 400) are shown on the x-axis, and the proportion of genes in each bin of ASE values are shown on the y-axis for genes with one-directional (black bars) and bidirectional (gray bars) ASE. The graph illustrates significantly larger ASE values in genes with bidirectional ASE than in genes with one-directional ASE (P = 1.4 × 10⁻¹²). (B) The variation in CpG site methylation for all CpG sites (n = 1306) is shown on the x-axis as bins of standard deviations (SD) for the methylation levels (beta-values from the GoldenGate assay) across samples for each individual CpG site. The proportion of CpG sites in each bin of SDs shown on the y-axis were obtained by dividing the number of CpG sites in each bin by the total number of CpG sites in genes with one-directional (black bars) and bidirectional (gray bars) ASE, respectively. The graph shows that genes with bidirectional ASE according to data from 267 SNPs display a larger variation in methylation levels than genes with one-directional ASE according to data from 203 SNPs (P = 2.2 × 10⁻⁵).
Figure 5.
Figure 5.
Correlation between ASE and CpG site methylation. Comparison of ASE levels between samples with low or high methylation levels (beta-value <0.25 or >0.75) and samples with intermediate methylation levels (beta-value 0.25–0.75) exemplified by three genes. ASE levels for DNAJC15 in samples with low or high beta-values (n = 42) and intermediate beta-values (n = 20) at the CpG site cg26288331 (unadjusted P = 5.7 × 10⁻⁷; permuted P = 2.0 × 10⁻⁴) (A), ZNF75A in samples with low or high beta-values (n = 67) and intermediate beta-values (n = 9) at the CpG site cg05506643 (unadjusted P = 4.2 × 10⁻⁶; permuted P = 2.0 × 10⁻⁴) (B), and TSPO in samples with low or high beta-values (n = 68) and intermediate beta-values (n = 7) at the CpG site cg06758027 (unadjusted P = 5.4 × 10⁻⁵; permuted P = 8.0 × 10⁻⁴) (C).
Figure 6.
Figure 6.
Correlation between ASE levels and CpG site methylation levels for the FAM24B gene in individual samples. (A) The methylation levels of the CpG site cg17560056 (red dots, left y-axis) and the absolute values for the ASE-levels (SNP rs1891110) (black dots, right y-axis) for FAM24B in individual heterozygous samples listed on the horizontal axis (n = 81). (B) The ASE-levels (y-axis) plotted against the methylation levels (x-axis) for FAM24B (black dots). The regression curve (R = 0.7; permuted P = 2.0 × 10⁻⁴) fitted to these data points is shown in red.

References

    1. Bibikova M., Lin Z., Zhou L., Chudin E., Garcia E.W., Wu B., Doucet D., Thomas N.J., Wang Y., Vollmer E., et al. High-throughput DNA methylation profiling using universal bead arrays. Genome Res. 2006;16:383–393. - PMC - PubMed
    1. Bjornsson H.T., Albert T.J., Ladd-Acosta C.M., Green R.D., Rongione M.A., Middle C.M., Irizarry R.A., Broman K.W., Feinberg A.P. SNP-specific array-based allele-specific expression analysis. Genome Res. 2008;18:771–779. - PMC - PubMed
    1. Bray N.J., Buckland P.R., Owen M.J., O'Donovan M.C. Cis-acting variation in the expression of a high proportion of genes in human brain. Hum. Genet. 2003;113:149–153. - PubMed
    1. Carayon P., Portier M., Dussossoy D., Bord A., Petitpretre G., Canat X., Le Fur G., Casellas P. Involvement of peripheral benzodiazepine receptors in the protection of hematopoietic cells against oxygen radical damage. Blood. 1996;87:3170–3178. - PubMed
    1. Cheok M.H., Evans W.E. Acute lymphoblastic leukaemia: A model for the pharmacogenomics of cancer therapy. Nat. Rev. Cancer. 2006;6:117–129. - PubMed

Publication types