Review
. 2008 Oct;14(5):487-502.
doi: 10.1177/1073858408317066.

Propagating waves of activity in the neocortex: what they are, what they do

Affiliations
Review

Propagating waves of activity in the neocortex: what they are, what they do

Jian-Young Wu et al. Neuroscientist. 2008 Oct.

Abstract

The development of voltage-sensitive dyes (VSD) and fast optical imaging techniques have brought us a new tool for examining spatiotemporal patterns of population neuronal activity in the neocortex. Propagating waves have been observed during almost every type of cortical processing examined by VSD imaging or electrode arrays. These waves provide subthreshold depolarization to individual neurons and increase their spiking probability. Therefore, the propagation of the waves sets up a spatiotemporal framework for increased excitability in neuronal populations, which can help to determine when and where the neurons are likely to fire. In this review, first discussed is propagating waves observed in various systems and possible mechanisms for generating and sustaining these waves. Then discussed are wave dynamics as an emergent behavior of the population activity that can, in turn, influence the activity of individual neurons. The functions of spontaneous and sensory-evoked waves remain to be explored. An important next step will be to examine the interaction between dynamics of propagating waves and functions in the cortex, and to verify if cortical processing can be modified when these waves are altered.


Figures

Fig. 1
Fig. 1
(A) Structural formula of commonly used voltage-sensitive dyes (VSD). (Top) RH482 (also known as NK3630), an absorption dye used for imaging neuronal activity in brain slices. (Bottom) RH1691, a fluorescent dye commonly used for imaging cortex in vivo. It is one of newly developed “blue” dyes, and it has small pulsation artifacts for imaging cortex in vivo (Shoham and others 1999). (Structural formulae for more dyes can be found at: http://square.umin.ac.jp/optical/optical/dye.html.) (B) Simultaneous VSD (dots) and intracellular (line) recordings from a squid giant axon. The axon is stained with an absorption dye. The two signals follow each other precisely, providing the first evidence that dye signal is membrane potential dependent. Note that although the linearity and temporal response of the dye signal are excellent, the amplitude of the dye signal is small, only about 0.1% change from the resting light level per 100 mV changes in membrane potential. (Reprint from Ross and others 1977, with permission from Springer.) (C, left) Simultaneous recordings of intra-cellular potential (whole-cell patch, red) from one cortical neuron and VSD signal (black) from the surrounding population of neurons. The cortex is stained with RH1691. Under anesthesia, cortical neurons undergo synchronized up and down states. The subthreshold membrane potential fluctuations are closely correlated with the VSD signal, but the spikes on individual neurons were not correlated with large deflections of the VSD signal. (C, right) The VSD signal is plotted against membrane potential changes, demonstrating a linear relationship. (Modified from Ferezou and others 2006, with permission from Elsevier.) (D) Simultaneous local field potential (LFP) and VSD recordings from the rat visual cortex, demonstrating the sensitivity of VSD imaging compared to that of LFP (microelectroencephalography). The top two traces show synchronized bursting activity recorded under 1.5% isoflurane anesthesia. The correlation is high between LFP and VSD signals. The bottom two traces were recorded later under lower anesthesia level. Both LFP and VSD signals show sleep-like oscillations but the correlation remains low. The poor correlation is unlikely attributed to the baseline noise, because the baseline noise of the analogous recording under higher anesthesia is low. (Reprint from Lippert and others 2007, with permission from the American Physiological Society.)
Fig. 2
Fig. 2
Mechanisms for generating and sustaining propagating waves in space. Open circles indicate excitable but not necessarily oscillatory neurons or neuronal tissue, and circles with ~ indicate local oscillators with frequency ν. For simplicity, in A–C only one-dimensional models are shown. (A) The fictitious wave motion is generated from a single generator that drives adjacent regions of cortex through increasing time delays of τD. ΔΨ = phase difference between neighboring units. (B) Wave motion originates from the transmission of an excitatory pulse along a network of cortical neurons. The propagation delay between neurons is τD. (C) Wave motion originates as a phase lag between neighboring neuronal oscillators. Function Γ determines the spatial phase shift, the isolated frequency, and the interactions. (D) Population interactions can generate spatial phase distribution (right) and the propagating direction (arrows) without any cellular pacemakers as that in A–C. As emergent properties of the spiral wave, oscillations (bottom) are generated by the rotation of the wave. At different locations (1 and 2) there is a phase lag due to the wave rotation. (A–C are modified from Ermentrout and Kleinfeld 2001, with permission from Elsevier.)
Fig. 3
Fig. 3
Oscillation and propagating wave in neocortical slices. The slices develop spontaneous oscillations of ~10 Hz when perfused with carbachol (100 μM) and bicuculline (10 μM). (A, top) The voltage-sensitive dyes (VSD) signal of the oscillation recorded by an optical detector (white square in the bottom images). (A, bottom) Snap shots of the VSD signals taken at different phases of an oscillation cycle as marked on the top trace. The pseudocolor images are converted from the amplitude of the VSD signals on many detectors in the field of view using a linear color scale (peak = red, baseline = blue, top right of the images). The white broken lines in the images mark the boundary of the cortical area of the slice. During each cycle of the oscillation, a propagating wave started from the bottom of the slice and propagated to the top end. This one-cycle-one-wave pattern is observed in all oscillation cycles. (B) A “space-time” map showing wave-to-wave interactions during the 10-Hz oscillations. The space-time map was made from VSD signals on one row of detectors horizontally arranged in cortical layers II–III (left schematic diagram, 10 detector, ~3 mm wide). During an epoch of spontaneous oscillations, at the beginning the waves initiated on the upper side of the slice and propagated downward (top, plane waves); later the top-down wave was interacted with a new wave initiated from the lower end of the slice (bottom, irregular patterns). (Modified from Bao and Wu 2003, with permission from the American Physiological Society.)
Fig. 4
Fig. 4
Wave-to-wave interactions in two dimensions. Wave-to-wave interactions caused rotating spiral waves. The preparation is a 6 × 6-mm2 patch from rat visual cortex (top left, schematic diagram), also known as a tangential cortical slice. (Top) The voltage-sensitive dyes (VSD) signal of the oscillation induced by carbachol and bicuculline. (Bottom) The images are made from five consecutive oscillation cycles marked by the line under the top trace; each row of images is from one of the cycles. The first two rows of images show that the wave started from a pacemaker at the bottom of the imaging field and propagated upward in a “ring wave” pattern. During the third cycle, the ring wave was broken up into two wave fronts and the two fronts collided (third row, marked by the arrow). A rotating spiral wave was generated afterward with a wave front. In the fourth and fifth rows, this spiral wave front started to rotate in the field of view and continued rotating for the next 20 to 30 cycles (not shown).
Fig. 5
Fig. 5
Four propagating components in turtle olfactory bulb with odor stimulus. (A) The DC component propagating from rostral to almost the entire bulb. (B–D) Three oscillatory components with different initiation loci, different propagation direction, and ranges (labeled by line circles). The center of the middle oscillation (B) remained relatively fixed. (Reprinted from Lam and others 2000, with permission from the Society for Neuroscience.)
Fig. 6
Fig. 6
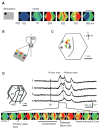
Evoked waves in visual cortex. (A) Visually evoked wave. The visual stimulus is a drifting grating within a small field of 6° in size. The left gray box shows the visual field and location of the stimulation (details in B). The visual stimulus evoked a wave propagating in V1 and toward V2. The six snapshots on the right are selected at the six stages of the propagating wave: from left, before onset, onset of primary wave, onset of wave compression, full compression, reflection, and the end of the primary/reflection wave complex. The number under each image is the poststimulus time (PST) in milliseconds. (B) Schematic diagram of the visual stimulation. The stimuli were projected onto a screen of 10 × 7 inches placed at 20 cm in front of the animal’s contralateral eye. The retinotopic map was made by presenting the drifting pattern (6° in size) at six locations on the screen (colored dots). (C) Retinotopic map in V1. Each circle represents the location of the response onset. The color of the circles represents the location of the visual stimulation in the field of view. The approximate coordinates of the stimulation sites are (in degrees from the center): yellow (−19, 11); red (0, 11); dark green (19, 11); blue (−19, 0); light green (0, 0); and purple (19, 0). All the data are from the same animal. The broken line marks the approximate position of V1/V2 border. (D, left) Schematic drawing of the imaging field (blue hexagon) overlying the map of the visual areas. Four optical detectors, 1–4, were selected and their signal traces are shown on the right. (D, right) Optical signals of visually evoked activity from four detectors (1–4). The onset of the visual stimulus is marked by the vertical line (St). The peak of the evoked activity occurred sequentially from detector 1 to 4, indicating a propagating wave (primary wave) from V1 to V2 (left broken line). A reflected wave can be seen starting from detector 3 and propagating backward to detector 1 (right broken line). The two waves can be clearly seen in the bottom images. (Bottom) Twelve images are selected from the initial response (time marked by the doted line under the traces). The first image was taken when the evoked primary wave first appeared in the V1 monocular area, approximately 104 msec after the grating started to drift. (Modified from Xu and others 2007, with permission from Elsevier.)
Fig. 7
Fig. 7
Propagating waves may contribute to the perception of visual illusion. Cortical representations of stationary, moving, and illusory moving stimuli. The line-motion illusion. (a) Square (“cue”) presented before a bar stimulus. (b) Subjects report illusory line drawing. (c–f) Patterns of evoked cortical activity as a function of time. Yellow dotted contours approximate retinotopic representation of the stimuli; white contours delimit low-amplitude activity (significance level, P < 0.05). The cortical area imaged is shown at upper right. Scale bar, 1 mm. P = posterior; M = medial. Green vertical lines in e indicate estimated position of the stimuli along posterior–anterior axis. Time in milliseconds after stimulus onset is shown at the top. Stimulation time is shown at the bottom of each row. Color scale indicates averaged fractional changes in fluorescence intensity (F/F). Stimuli: c = flashed small square; d = flashed bar; e = moving small square (32° s-1); f = line-motion paradigm. A total of 22 repetitions were averaged. (Reprinted from Jancke and others 2004, with permission from Nature.)
Fig. 8
Fig. 8
Variations in propagating direction and velocity. (A) Variations of evoked waves in rat barrel cortex. Eight trials (rows 1–8) are shown with identical whisker deflection. The bottom images (AVG) are averaged from 105 trials from the same animal. (Bottom row, left) Schematic diagram of the barrel pattern and the imaging field. (Bottom row, right) The contour lines show the isolevels of the relative amplitude of the population membrane potentials. The different colors indicate different trials. Each of the four maps then consists of contour lines superimposed from trials 3 (red), 4 (yellow), 6 (green), and 8 (blue), along with contour lines from the averaged data (gray). Responses in some trials (4, 6) are similar to the average (gray), whereas in some trials (3, 8) propagating direction and velocity are very different. (Modified from Lippert and others 2007, with permission from the American Physiological Society.) (B) Variations of evoked waves in rat visual cortex. (Top image) Schematic drawing of the imaging field (blue hexagon) overlying the map of the visual areas. A horizontal row of detectors is selected to make space-time map in the bottom images. (Top) A visual stimulus evoked a primary wave (1) and a number of secondary waves (2–4). (Bottom) 1, the primary forward/reflex wave complex with compressions as seen in Figure 6D. 2–4, secondary waves following the primary wave, showing variations in propagating velocity and direction. In particular, there is a wave collision in the first part of wave 2, and in wave 3 there is a wave split; wave 4 is much slower than the others. Note that only the primary wave shows a compression/reflection pattern.

Similar articles

Cited by

References

    1. Albowitz B, Kuhnt U. Epileptiform activity in the guinea-pig neocortical slice spreads preferentially along supragranular layers—recordings with voltage-sensitive dyes. Eur J Neurosci. 1995;7:1273–84. - PubMed
    1. Anderson WW, Lewis DV, Swartzwelder HS, Wilson WA. Magnesium-free medium activates seizure-like events in the rat hippocampal slice. Brain Res. 1986;398:215–9. - PubMed
    1. Arieli A, Shoham D, Hildesheim R, Grinvald A. Coherent spatiotemporal patterns of ongoing activity revealed by real-time optical imaging coupled with single-unit recording in the cat visual cortex. J Neurophysiol. 1995;73:2072–93. - PubMed
    1. Arieli A, Sterkin A, Grinvald A, Aertsen A. Dynamics of ongoing activity: explanation of the large variability in evoked cortical responses. Science. 1996;273:1868–71. - PubMed
    1. Bai L, Huang X, Yang Q, Wu JY. Spatiotemporal patterns of an evoked network oscillation in neocortical slices: coupled local oscillators. J Neurophysiol. 2006;96:2528–38. - PMC - PubMed

Publication types

MeSH terms

Substances

LinkOut - more resources