

Rising use of diagnostic medical imaging in a large integrated health system
- PMID: 18997204
- PMCID: PMC2765780
- DOI: 10.1377/hlthaff.27.6.1491
Rising use of diagnostic medical imaging in a large integrated health system
Abstract
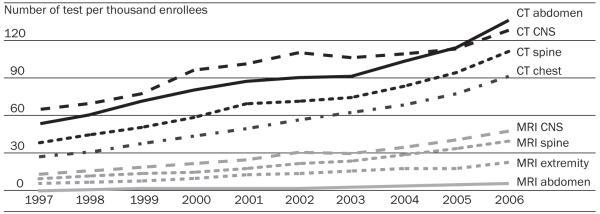
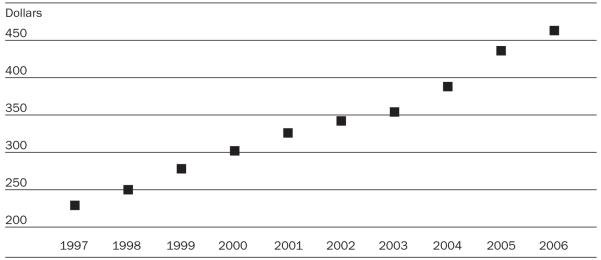
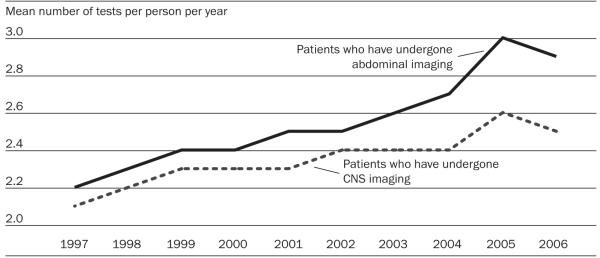
Little has been published characterizing specific patterns of the dramatic rise in diagnostic imaging during the past decade. In a large health plan, 377,048 patients underwent 4.9 million diagnostic tests from 1997 through 2006. Cross-sectional imaging nearly doubled over those years, rising from 260 to 478 examinations per thousand enrollees per year. Imaging with computed tomography (CT) doubled, and imaging with magnetic resonance imaging (MRI) tripled. Cross-sectional studies added to existing studies instead of replacing them, and the annual per enrollee cost of radiology imaging more than doubled. The dramatic rise in imaging raises both costs and radiation exposure.
Figures


Comment in
-
Some facts on rapid imaging growth.Health Aff (Millwood). 2009 Mar-Apr;28(2):599; author reply 599-600. doi: 10.1377/hlthaff.28.2.599. Health Aff (Millwood). 2009. PMID: 19276031 No abstract available.
References
-
-
Medicare Payment Advisory Commission A Data Book: Healthcare Spending and the Medicare Program. Jun2007. [accessed 15 September 2008]. http://www.medpac.gov/documents/Jun07DataBook_Entire_report.pdf.andAmis ES, Jr., et al. American College of Radiology White Paper on Radiation Dose in Medicine. Journal of the American College of Radiology. 2007;4(5):272–284.
-
-
- MedPAC . A Data Book: Healthcare Spending and the Medicare Program.
-
-
Bhargavan M, Sunshine JH. Utilization of Radiology Services in the United States: Levels and Trends in Modalities, Regions, and Populations. Radiology. 2005;234(3):824–832.Burkhardt JH, Sunshine JH. Utilization of Radiologic Services in Different Payment Systems and Patient Populations. Radiology. 1996;200(1):201–207.andMitchell JM. Utilization Trends for Advanced Imaging Procedures: Evidence from Individuals with Private Insurance Coverage in California. Medical Care. 2008;46(5):460–466.
-
-
-
The approximate costs associated with each radiology procedure can be accessed on the CMS Web site. SeeCenters for Medicare and Medicaid Services Physician Fee Schedule Search. Aug 202008. [accessed 22 August 2008]. http://www.cms.hhs.gov/apps/ama/license.asp?file=/pfslookup/02_pfssearch.asp.
-
-
-
See Online Exhibit 1, available at http://content.healthaffairs.org/cgi/content/full/27/6/1491/DC1.
-
MeSH terms
Grants and funding
LinkOut - more resources
Full Text Sources
Other Literature Sources
Medical
Miscellaneous