. 2008 Dec;15(12):1293-301.
doi: 10.1038/nsmb.1511. Epub 2008 Nov 9.

Structure of the Shigella T3SS effector IpaH defines a new class of E3 ubiquitin ligases

Affiliations

Structure of the Shigella T3SS effector IpaH defines a new class of E3 ubiquitin ligases

Alexander U Singer et al. Nat Struct Mol Biol. 2008 Dec.

Abstract

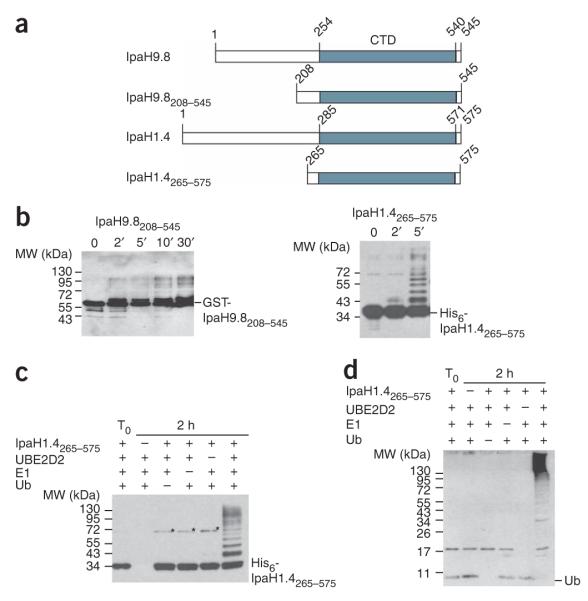
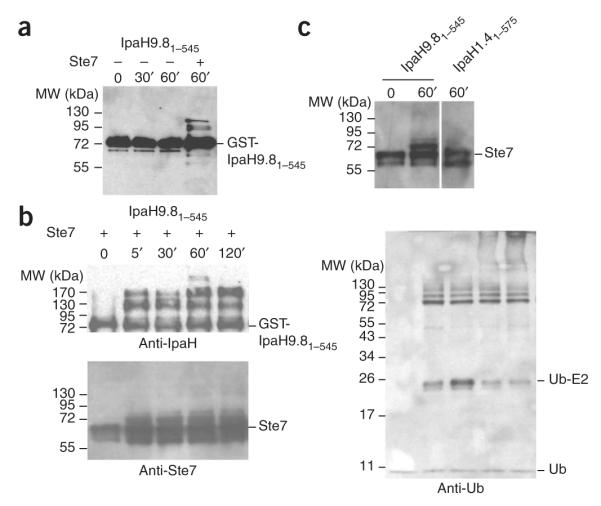
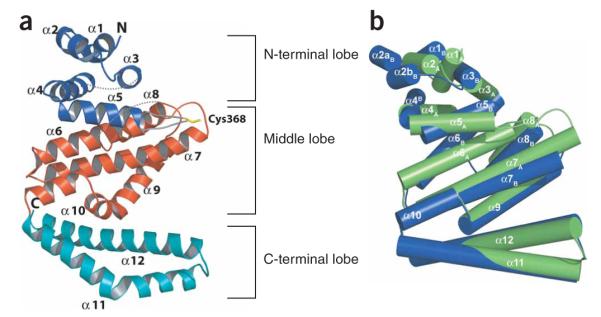
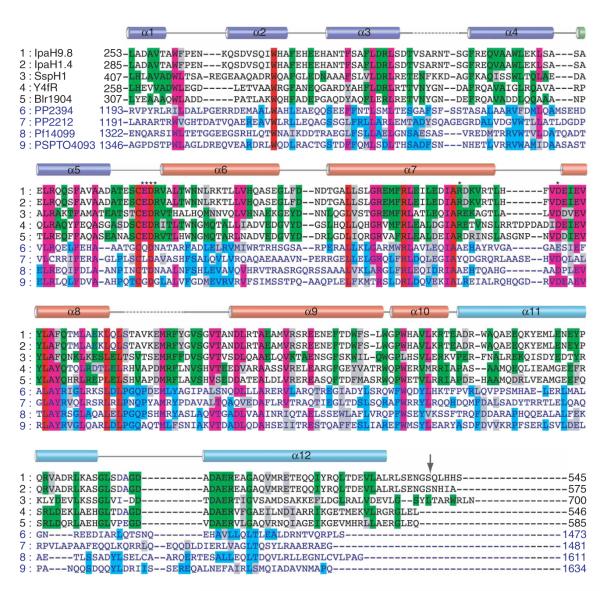
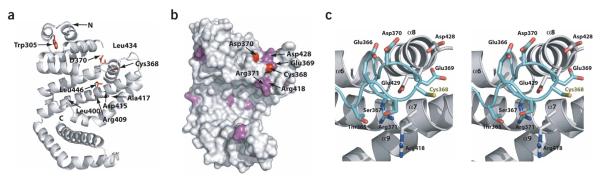
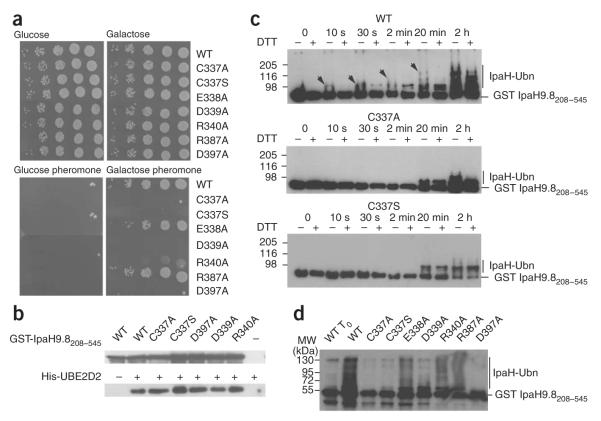
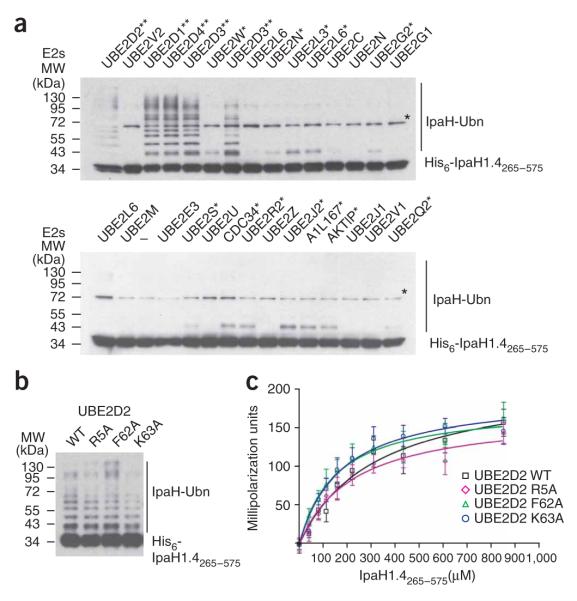
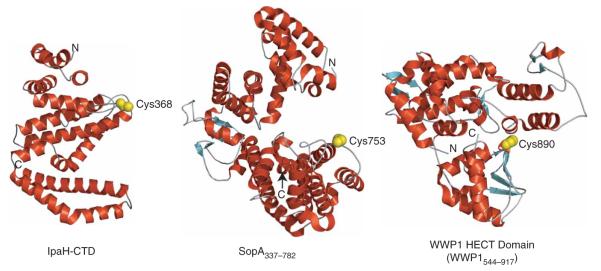
IpaH proteins are E3 ubiquitin ligases delivered by the type III secretion apparatus into host cells upon infection of humans by the Gram-negative pathogen Shigella flexneri. These proteins comprise a variable leucine-rich repeat-containing N-terminal domain and a conserved C-terminal domain harboring an invariant cysteine residue that is crucial for activity. IpaH homologs are encoded by diverse animal and plant pathogens. Here we demonstrate that the IpaH C-terminal domain carries the catalytic activity for ubiquitin transfer and that the N-terminal domain carries the substrate specificity. The structure of the IpaH C-terminal domain, determined to 2.65-A resolution, represents an all-helical fold bearing no resemblance to previously defined E3 ubiquitin ligases. The conserved and essential cysteine residue lies on a flexible, surface-exposed loop surrounded by conserved acidic residues, two of which are crucial for IpaH activity.


Figures

Figure 1
Figure 1
The C-terminal domain of IpaH proteins shows E3 ubiquitin-ligase activity. (a) Schematic representation of IpaH9.8 and IpaH1.4 C-terminal fragments (not to scale). The IpaH-CTD is shown in gray, and its position in each IpaH protein is indicated. (b) Immunoblot analysis using anti-IpaH antibodies of reactions performed in the presence of ATP, ubiquitin, E1, UBE2D2 and GST-IpaH9.8208–545 or His6-IpaH1.4265–575. The positions of native GST-IpaH9.8208–545 and His6-IpaH1.4265–575 are indicated on the right. (c,d) Immunoblot analysis with anti-IpaH (c) and anti-ubiquitin (d) antibodies in the presence or absence of ATP, ubiquitin, E1, UBE2D2 and His6-IpaH1.4265–575. The reactions were performed at 25 °C for 2 h (except for T0, which represents the degree of ubiquitination at t = 0 min). The stars mark the 70-kDa species corresponding to the dimer of IpaH1.4265–575 possibly formed through a disulfide bond between cysteine residues in IpaH1.4265–575 monomers.
Figure 2
Figure 2
E3 ubiquitin ligase activity of full-length IpaH proteins. (a) Immunoblot analysis using anti-IpaH antibodies of reactions performed in the presence of ATP, ubiquitin, E1, UBE2D2 and GST-IpaH9.81–545. The reaction mixture performed in the presence of a complex containing Ste7, Ste11-4 and Kss1 is indicated. (b) Immunoblot analysis using anti-IpaH (above left), anti-Ste7 (below left) and anti-ubiquitin (right) antibodies of reactions performed in the presence of ATP, ubiquitin, E1, UBE2D2, GST-IpaH9.81–545 and a complex containing Ste7, Ste11-4 and Kss1. (c) Immunoblot analysis using anti-Ste7 antibodies of reactions performed in the presence of ATP, ubiquitin, E1, UBE2D2 and GST-IpaH9.81–545 or His6-IpaH1.41–575 and a complex containing Ste7, Ste11-4 and Kss1. Reactions were incubated for the times indicated. Samples were treated with DTT before loading.
Figure 3
Figure 3
Overall structure of the IpaH1.4 C-terminal domain. (a) Ribbon representation of the IpaH-CTD in molecule A; the N-terminal, middle and C-terminal lobes are colored in blue, red and cyan, respectively. The loop between helices α5 and α6 is colored in gray with Cys368 in yellow. The unstructured loops between residues 329 to 334 and 449 to 462 are indicated as dashed lines, and the N and C termini are labeled. (b) Superimposition of molecules A and B present in the asymmetric unit. Each IpaH polypeptide is shown by cylindrical helices, with molecule A in green and molecule B in blue, and positions of each helix in molecules A and B are labeled. In molecule B, residue 303 was not modeled owing to poor electron density, and helix α2 is split in two parts (α2aB and α2bB).
Figure 4
Figure 4
Multiple sequence alignment of IpaH homologs. The alignment is restricted to the C-terminal domain identical in all IpaH proteins (IpaH-CTD), which spans residues 254 to 540 (indicated by arrow) in IpaH9.8 and residues 285 to 571 in IpaH1.4. A set of nine representative proteins was selected from the alignment of 25 IpaH homologs including (1) IpaH9.8 and (2) IpaH1.4 from S. flexneri, (3) SspH1 from Salmonella typhimurium, (4) Y4fR from Rhizobium spp., (5) Blr1904 from Bradyrhizobium japonicum, (6) PP1072 and (7) PP2212 from Pseudomonas putida, (8) Pfl14099 from Pseudomonas fluorescens and (9) PSPTO4093 from P. syringae pv. tomato. Sequences of the C-terminal domain of the ~600-residue proteins (rows 1–5) and ~1,500-residue proteins (rows 6–9) are shown in black and blue characters, respectively. Identical residues within sequences of the first and second groups are highlighted in green and blue, respectively. Residues that are identical in all or most sequences are highlighted in red and purple, respectively. Secondary-structure elements derived from the structure of the IpaH1.4 C-terminal domain are shown above the sequence alignment and labeled. The broken lines correspond to the disordered regions in the structure. The α-helices that are part of N-terminal, middle and C-terminal lobes are colored blue, red and cyan, respectively. Residues selected for mutagenesis are marked with asterisks.
Figure 5
Figure 5
Environment of the conserved cysteine residue. (a) Ribbon diagram of IpaH-CTD (molecule A). The nine invariant residues are shown in a stick representation, labeled and colored in red. The N and C termini are labeled. (b) Overall surface of IpaH-CTD. Positions of surface-exposed invariant residues are colored red, whereas residues conserved only among a subset of IpaH proteins are colored purple. Cys368 and Asp370 are the only residues from a that appear in this view. The surface-exposed regions for the six residues mutated to alanine or serine are labeled. (c) Close-up of the region of the IpaH-CTD structure around the cysteine-containing loop in stereo. Residues in this loop as well as three nearby residues subjected to mutagenesis are shown in a stick representation and labeled. Carbon atoms in this loop are colored cyan and other residues are represented with their carbon atoms uncolored. All nitrogen, oxygen and sulfur atoms are colored blue, red and yellow, respectively.
Figure 6
Figure 6
Functional analysis of conserved residues. (a) Growth on glucose- or galactose-containing plates of serial dilutions of sst2Δ yeast cells harboring plasmids encoding indicated proteins (WT, wild-type IpaH9.8-Flag; C337A; IpaH9.8 in which Cys337 is replaced by alanine (the same nomenclature is used for the other variants)). Below, plates containing α-factor are shown. (b) Immunoblot analysis with anti-IpaH (above) and anti-His (below) antibodies of eluates from glutathione beads added to GST-IpaH9.8208–545 or its C337A, C337S, D397A, D339A and R340A variants incubated with His6-UBE2D2. (c) Immunoblot analysis using anti-IpaH antibodies of reactions performed in the presence of ATP, ubiquitin, E1, UBE2D2, GST-IpaH9.8208–545 (WT, above) or its C337A (middle) and C337S (below) variants. Samples were incubated at 25 °C for the indicated time and treated (+) or not treated (-) with DTT before loading. Arrows indicate the DTT-sensitive species. (d) Immunoblot analysis using anti-IpaH antibodies of reactions performed in the presence of ATP, ubiquitin, E1, UBE2D2, GST-IpaH9.8208–545 or the GST-IpaH9.8208–545 variants carrying the indicated replacement. Samples were incubated at 25 °C for 30 min (except for WT To, which represents the degree of ubiquitination of the wild-type protein at t = 0 min) and treated with DTT before loading.
Figure 7
Figure 7
IpaH interactions with E2 conjugating enzymes. (a) Immunoblot analysis using anti-IpaH antibodies of reactions performed in the presence of ATP, ubiquitin, E1, IpaH1.4265–575 and one of the indicated human E2 enzymes. The reactions were performed at 25 °C for 40 min. The double asterisk indicates the E2s supporting the strong autoubiquitination reaction. Single asterisk indicates the E2s supporting formation of only a single modified species. A star indicates the (70 kDa) species that is present in all lanes, including the one that did not contain any E2 (below, third lane). This band would correspond to a dimer of IpaH1.4265–575, presumably formed through a disulfide bond between cysteine residues in IpaH265–575 monomers (see also Fig. 1). The E2 nomenclature is in accordance with that used by the Human Genome Organization (http://www.genenames.org/genefamily/ube2.php). The reaction with UBE2D3 E2 was done in duplicate (above, lanes 5 and 7). (b) Immunoblot analysis using anti-IpaH antibodies showing IpaH1.4265–575 autoubiquitination in the presence of wild type (WT) and R5A, F62A and K63A UBE2D2 variants. Reactions were performed at 25 °C for 5 min. (c) Determination of the dissociation constants of IpaH1.4265–575 interactions with UBE2D2 using fluorescence polarization. The change in fluorescence polarization of fluorescein-labeled UBE2D2 (WT) or its indicated variants are plotted as a function of IpaH1.4265–575 concentration with error bars indicating s.d.
Figure 8
Figure 8
Structures of different classes of E3 ligases in which a cysteine residue is essential for activity. Helices are shown in red, strands in cyan and loops in gray. The positions of the N and C termini of each protein are indicated by N and C. The WWP1 HECT domain (PDB 1ND7) is used to represent the HECT domain fold. The catalytic cysteine (α- and β-carbon and γ-sulfur atoms) is shown as a space-filling model and colored yellow.

References

    1. Bhavsar AP, Guttman JA, Finlay BB. Manipulation of host-cell pathways by bacterial pathogens. Nature. 2007;449:827–834. - PubMed
    1. Galán JE, Cossart P. Host-pathogen interactions: a diversity of themes, a variety of molecular machines. Curr. Opin. Microbiol. 2005;8:1–3. - PubMed
    1. Ardley HC, Robinson PA. E3 ubiquitin ligases. Essays Biochem. 2005;41:15–30. - PubMed
    1. Mattoo S, Lee YM, Dixon JE. Interactions of bacterial effector proteins with host proteins. Curr. Opin. Immunol. 2007;19:392–401. - PubMed
    1. Abramovitch RB, Janjusevic R, Stebbins CE, Martin GB. Type III effector AvrPtoB requires intrinsic E3 ubiquitin ligase activity to suppress plant cell death and immunity. Proc. Natl. Acad. Sci. USA. 2006;103:2851–2856. - PMC - PubMed

Publication types

MeSH terms

Associated data

LinkOut - more resources