. 2008;3(11):e3645.
doi: 10.1371/journal.pone.0003645. Epub 2008 Nov 10.

Genomic androgen receptor-occupied regions with different functions, defined by histone acetylation, coregulators and transcriptional capacity

Affiliations

Genomic androgen receptor-occupied regions with different functions, defined by histone acetylation, coregulators and transcriptional capacity

Li Jia et al. PLoS One. 2008.

Abstract

Background: The androgen receptor (AR) is a steroid-activated transcription factor that binds at specific DNA locations and plays a key role in the etiology of prostate cancer. While numerous studies have identified a clear connection between AR binding and expression of target genes for a limited number of loci, high-throughput elucidation of these sites allows for a deeper understanding of the complexities of this process.

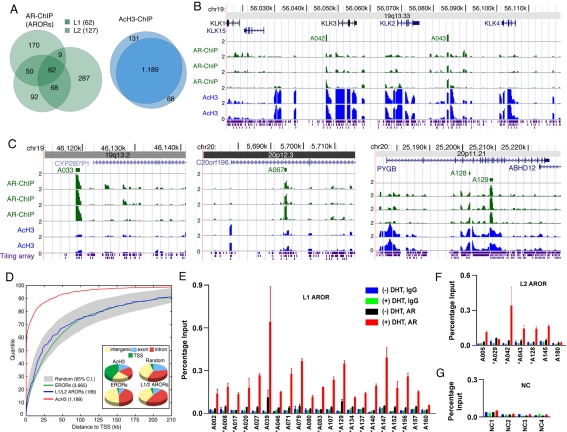
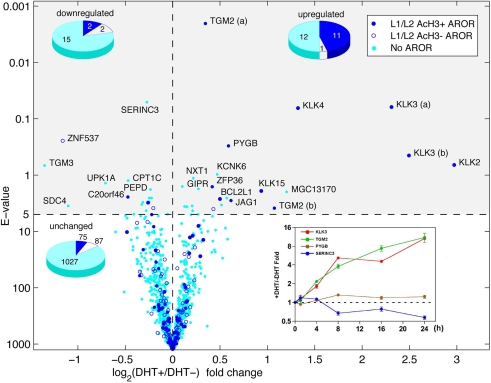
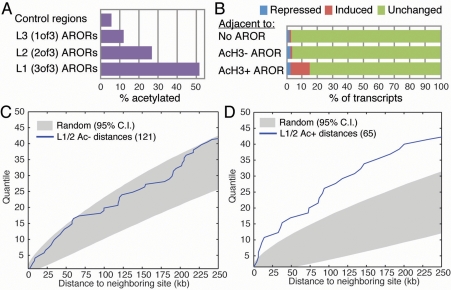
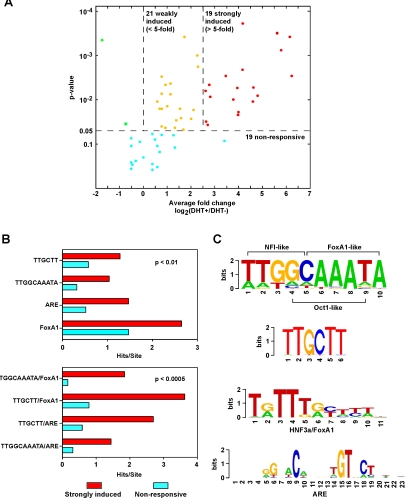
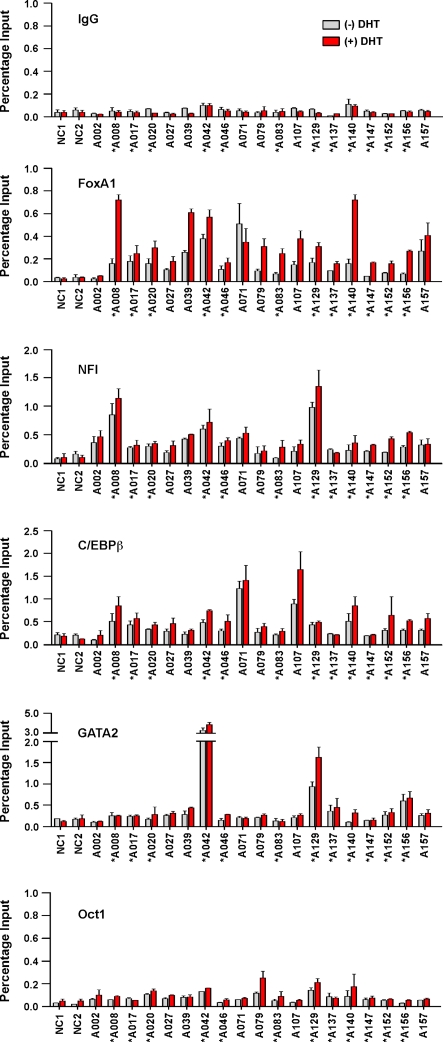
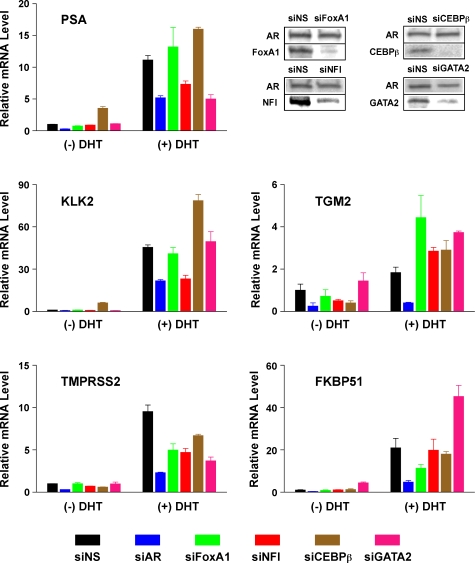
Methodology/principal findings: We have mapped 189 AR occupied regions (ARORs) and 1,388 histone H3 acetylation (AcH3) loci to a 3% continuous stretch of human genomic DNA using chromatin immunoprecipitation (ChIP) microarray analysis. Of 62 highly reproducible ARORs, 32 (52%) were also marked by AcH3. While the number of ARORs detected in prostate cancer cells exceeded the number of nearby DHT-responsive genes, the AcH3 mark defined a subclass of ARORs much more highly associated with such genes -- 12% of the genes flanking AcH3+ARORs were DHT-responsive, compared to only 1% of genes flanking AcH3-ARORs. Most ARORs contained enhancer activities as detected in luciferase reporter assays. Analysis of the AROR sequences, followed by site-directed ChIP, identified binding sites for AR transcriptional coregulators FoxA1, CEBPbeta, NFI and GATA2, which had diverse effects on endogenous AR target gene expression levels in siRNA knockout experiments.

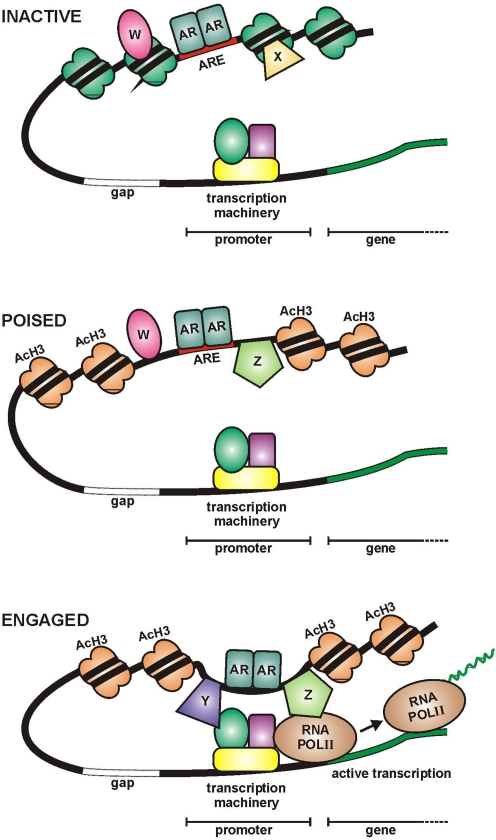
Conclusions/significance: We suggest that only some ARORs function under the given physiological conditions, utilizing diverse mechanisms. This diversity points to differential regulation of gene expression by the same transcription factor related to the chromatin structure.


Conflict of interest statement

Competing Interests: The authors have declared that no competing interests exist.

Figures

Figure 1
Figure 1. Characterization of ARORs and AcH3 regions on chromosome 19 and 20.
Three replicate ChIP-chip experiments identified 738 Androgen Receptor Occupied Regions (ARORs), 62 of which were common to all three replicates (L1 ARORs) and 127 common to only two of three (L2 ARORs), while two replicate ChIP-chip experiments identified 1,388 regions with acetylated histone H3 marks, 1,189 of which were present in both replicates (A). Genome plots are shown for the kallikrein locus (B) and three other AROR-containing loci (C), where AR-ChIP peaks are labeled, and raw log2 ratios [from 0 (1-fold) to 2 (4-fold)] for each replicate are shown in green (AR-ChIP) and blue (AcH3-ChIP). Panel (D) shows the genomic positioning of the 189 L1/L2 AROR peaks and 1,189 AcH3 peaks. A cumulative distribution plot (outer) shows that the distance from annotated transcription start sites (TSSs) is similar between ARORs, Estrogen Receptor Occupied Regions (ERORs) from , and randomly selected regions from the repeat-masked tiling array, while a majority of AcH3 peaks are located at or near TSSs. All three classes (AROR, EROR, and AcH3) are excluded from exons relative to randomly selected regions (insert). The selected ARORs were validated by independent ChIP-qPCR (E–G). C4-2B cell were incubated in phenol red-free RPMI 1640 containing 5% CSS for 3 days and then treated with 10 nM DHT or ethanol (EtOH) vehicle for 4 h. Conventional site-specific ChIP assays were performed with anti-AR antibody. Normal IgG was used in parallel. Twenty-one L1 ARORs (E), 7 L2 ARORs (F) and 4 negative control (NC) (see table S4) (G) regions were examined by TaqMan qPCR. Acetylated ARORs are indicated by asterisks. A042 (F) is the PSA enhancer and acted as a positive control. All values are presented as percentage of input.
Figure 2
Figure 2. DHT-responsive genes in C4-2B cells.
Illumina expression arrays were used to measure expression levels of 46,713 transcripts in three replicates before and three replicates after DHT exposure in C4-2B cells, including the 1,232 RefSeq transcripts within our chromosome 19/20 genome tiling arrays, which are shown here. The student's t-test was used to determine statistical significance, and p-values were adjusted based on random permutations of the full dataset. This volcano plot shows the E-value (number of transcripts at the given p-value expected by chance) plotted against the mean fold change. 24 transcripts up-regulated at the E = 5 level (permutation-adjusted p-value = 0.003) and 19 transcripts down-regulated, are shown in the upper two quadrants. Transcripts are color-coded based on whether they are adjacent to an AROR, and the up-regulated transcripts show an elevated number adjacent to acetylated, but not un-acetylated, ARORs. The inset shows a time course of endogenous gene expression. C4-2B cells were cultured in hormone-depleted medium for 3 days and then treated with DHT (10 nM) or ethanol vehicle for the indicated times. Expression levels of 4 representative genes were measured by real-time RT-PCR. The data is normalized to 18S expression in log scale; Values are fold changes over the vehicle control at each time point.
Figure 3
Figure 3. Histone H3 acetylation defines a distinct subclass of ARORs.
Histone H3 acetylation peaks overlap 52% of the most reproducible L1 ARORs, but only 27% of the L2 ARORs, 12% of the L3 ARORs, and 6% of random sequences from the area covered by the chromosome 19/20 tiling array (A). Transcripts adjacent to acetylated ARORs are significantly more likely to be up-regulated in C4-2B cells, with 12.5% of transcripts showing up-regulation, as opposed to 1.1% of those adjacent to un-acetylated ARORs, and 1.1% of those not adjacent to any AROR; this was not the case for repressed genes (B). While un-acetylated L1/L2 ARORs are about as likely as randomized controls to cluster on the genome as shown by the cumulative distribution plot of inter-AROR distances (C), acetylated ARORs show significantly more genomic clustering (D).
Figure 4
Figure 4. Most ARORs have enhancer potential (transactivation activity), which is associated with several sequence motifs.
Transient transfection luciferase reporter assays were carried out in duplicate, and repeated independently at least 3 times for 61 of 62 L1 ARORs before and after DHT exposure, and the results are displayed in a volcano plot (4A) which shows the fold change between DHT+ and DHT- luciferase levels and the p-value significance level by the Student's t-test. At the p<0.05 level, 19 ARORs (31%) were strongly induced, while 21 ARORs (34%) were weakly induced. From L1 ARORs, 52 sequence motifs from Transfac and de novo motif discovery algorithms were found to be significantly enriched (see text). We performed chi-square tests to determine those motifs (B, upper) and motif pairs (B, lower) significantly enriched in the 18 strongly induced (red bars) vs. the 19 non-responsive (blue bars) ARORs. Four motifs were identified (C), including binding sites for FoxA1, the AR, along with two de novo motifs with similarity to FoxA1, NFI, and Oct1.
Figure 5
Figure 5. Occupancies of AR-coregulators on selected ARORs.
C4-2B cells were cultured in hormone-depleted medium for 3 days and then treated with 10 nM DHT or ethanol vehicle for 4 h. Conventional site-specific ChIP assays were performed with indicated antibodies. Nineteen ARORs and 2 negative control (NC) regions were examined by qPCR. The values are presented as percentage of input.
Figure 6
Figure 6. Expression of AR target genes after siRNA-mediated knockdown of coregulators.
C4-2B cells were transfected with siRNA targeting AR, FoxA1, NFI, CEBPβ, GATA2 or non-specific (NS) regions. Two days after transfection, cells were treated with 10 nM DHT or ethanol vehicle for 18 h. Expression levels of five AR target genes were examined by real-time RT-PCR. Relative mRNA level was normalized by GAPDH mRNA. Efficiency of each siRNA knockdown was measured by immunoblot with indicated antibodies (upper right).
Figure 7
Figure 7. Schematic model of AROR functions.
Three types of AR/DNA engagements are envisioned. Inactive ARORs represent AR occupying sites of relatively condensed chromatin along with coregulators W & X; these sites may simply be reservoir of AR to be used during dramatic changes in physiological conditions. Poised ARORs represent AR at AcH3 modified sites ready to engage the transcription initiation machinery, but held in check by coregulaters W & Z. Engaged ARORs represent AR actively mediating transcriptional control of target gene(s) by looping across varying genomic distances perhaps assisted by coregulators Y & Z.

References

    1. Rosenfeld MG, Glass CK. Coregulator codes of transcriptional regulation by nuclear receptors. J Biol Chem. 2001;276:36865–36868. - PubMed
    1. Carroll JS, Meyer CA, Song J, Li W, Geistlinger TR, et al. Genome-wide analysis of estrogen receptor binding sites. Nat Genet. 2006;38:1289–1297. - PubMed
    1. Wang Q, Li W, Liu XS, Carroll JS, Janne OA, et al. A hierarchical network of transcription factors governs androgen receptor-dependent prostate cancer growth. Mol Cell. 2007;27:380–392. - PMC - PubMed
    1. Bolton EC, So AY, Chaivorapol C, Haqq CM, Li H, et al. Cell- and gene-specific regulation of primary target genes by the androgen receptor. Genes Dev. 2007;21:2005–2017. - PMC - PubMed
    1. Massie CE, Adryan B, Barbosa-Morais NL, Lynch AG, Tran MG, et al. New androgen receptor genomic targets show an interaction with the ETS1 transcription factor. EMBO Rep 2007 - PMC - PubMed

Publication types