. 2008 Nov 12;16(11):1659-67.
doi: 10.1016/j.str.2008.08.018.

Genome pool strategy for structural coverage of protein families

Affiliations

Genome pool strategy for structural coverage of protein families

Lukasz Jaroszewski et al. Structure. .

Abstract

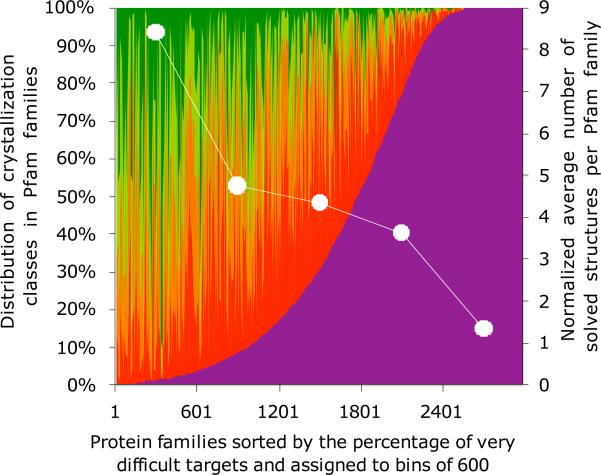
Even closely homologous proteins often have different crystallization properties and propensities. This observation can be used to introduce an additional dimension into crystallization trials by simultaneous targeting multiple homologs in what we call a "genome pool" strategy. We show that this strategy works because protein physicochemical properties correlated with crystallization success have a surprisingly broad distribution within most protein families. There are also "easy" and "difficult" families where this distribution is tilted in one direction. This leads to uneven structural coverage of protein families, with more "easy" ones solved. Increasing the size of the "genome pool" can improve chances of solving the "difficult" ones. In contrast, our analysis does not indicate that any specific genomes are "easy" or "difficult". Finally, we show that the group of proteins with known 3D structures is systematically different from the general pool of known proteins and we assess the structural consequences of these differences.


Figures

Figure 1
Figure 1
(A) The probability of crystallization is shown as a function of sequence identity to the closest crystallized, homologous target (see Materials and Methods). Each protein was assigned to the appropriate bin, according to its distance (as measured by sequence identity) to the closest crystallized homolog, and to another bin, according to its distance (again measured by sequence identity) to the closest homolog that failed to crystallize. The bins correspond to the following ranges of sequence identity: 99–90%, 89–60%, 59–50%, 49–40%, 39–30%, and 29–20% (n.b., the second bin is larger since smaller bins did not amass sufficient data). The crystallization successes and failures were then counted for each bin, and the success rate was calculated. In each bin, the number of crystallized proteins is shown as a blue bar, and the number of proteins that failed to crystallize is shown as a gray bar. The success rate (right vertical axis) was calculated directly from the histograms as a percentage of crystallized targets per bin and is shown as a black line. (B) The probability of crystallization shown as a function of sequence identity to the closest homologous target that failed to crystallize. Prepared as in A (see Materials and Methods). (C) The probability of crystallization shown as a function of two variables: sequence identity to the closest homologous target that crystallized and the sequence identity to the closest homolog that failed to crystallize. Figures A and B are one-dimensional projections of the figure shown here; see the detailed explanation of Figure A above and in the body of the manuscript.
Figure 2
Figure 2
The distribution of protein crystallization feasibility classes in known microbial genomes. Genomes of thermophilic organisms, host-associated organisms, and others are shown separately. Inside each group, genomes are sorted by the percentage of proteins in the very difficult class (magenta graph).
Figure 3
Figure 3
Increasing coverage of known PfamA families from sequencing of microbial genomes. The color coding reflects the different crystallizability scoring classes. Green curve—the number of PfamA families with at least one target in the optimal crystallizability class; light-green curve—the cumulative number of PfamA families with members in the two top crystallizability classes (optimal and suboptimal); yellow curve—the three top classes; and red curve—all but the fifth crystallizability class (very difficult). The magenta graph shows the number of PfamA families covered by proteins from all crystallization classes (optimal to very difficult). The differences and transitions for one color to the next then indicate the sequential additions of Pfam families covered from considering optimal through to very difficult in 5 steps of the classifications. The statistics are shown separately for all PfamA families (A) and for families that still do not contain any solved structures (B). As might be anticipated, there are fewer optimal targets and more very difficult targets in Pfam families with no solved structures.
Figure 4
Figure 4
The distribution of solved structures in protein families assigned with different levels of difficulty. The families were first sorted by the percentage of the very difficult targets (crystallizability class 5) and then split into six bins of 500 families corresponding to different levels of difficulty. After sorting, the first bin contains families with the lowest percentage of very difficult targets, and the last bin contains families consisting almost exclusively of very difficult targets, i.e., akin to the five relative scoring classes from optimal (green) to very difficult (magenta) as colored on the graph. The distributions of crystallizability classes (green to magenta) are shown for all protein families (left y axis). The normalized average number of structures per protein family has been calculated for each bin (right y axis). By using normalization, we are taking into account differences in family sizes—the average number of solved structures per family has been multiplied by the ratio of the average family size in all five bins to the average family size in a given bin.
Figure 5
Figure 5
Distributions of parameters describing various features (length, gravy index, pI, instability index, length of disordered fragment, and percentage of coil structure) of protein sequences calculated for: full sequences of microbial members of PfamA families with at least one solved structure (green graphs), full sequences of all solved structures from PfamA families (blue graphs), sequences of actual constructs of solved structures from PfamA families (black graphs), and full sequences of microbial members of PfamA families without any solved structures (red graphs). For more details, see Results and Discussion section.

References

    1. Altschul SF, Gish W, Miller W, Myers EW, Lipman DJ. Basic local alignment search tool. J Mol Biol. 1990;215:403–410. - PubMed
    1. Carter CW, Jr., Carter CW. Protein crystallization using incomplete factorial experiments. J Biol Chem. 1979;254:12219–12223. - PubMed
    1. Chen L, Oughtred R, Berman HM, Westbrook J. TargetDB: a target registration database for structural genomics projects. Bioinformatics. 2004;20:2860–2862. - PubMed
    1. Creighton TE. Proteins: Structures and Molecular Properties. New York: 1984.
    1. Eddy SR. Profile hidden Markov models. Bioinformatics. 1998;14:755–763. - PubMed

Publication types