. 2008 Nov;15(5):781-91.
doi: 10.1016/j.devcel.2008.09.007.

Atlas of gene expression in the developing kidney at microanatomic resolution

Affiliations

Atlas of gene expression in the developing kidney at microanatomic resolution

Eric W Brunskill et al. Dev Cell. 2008 Nov.

Erratum in

  • Dev Cell. 2009 Mar;16(3):482. Yu, Jing [added]

Abstract

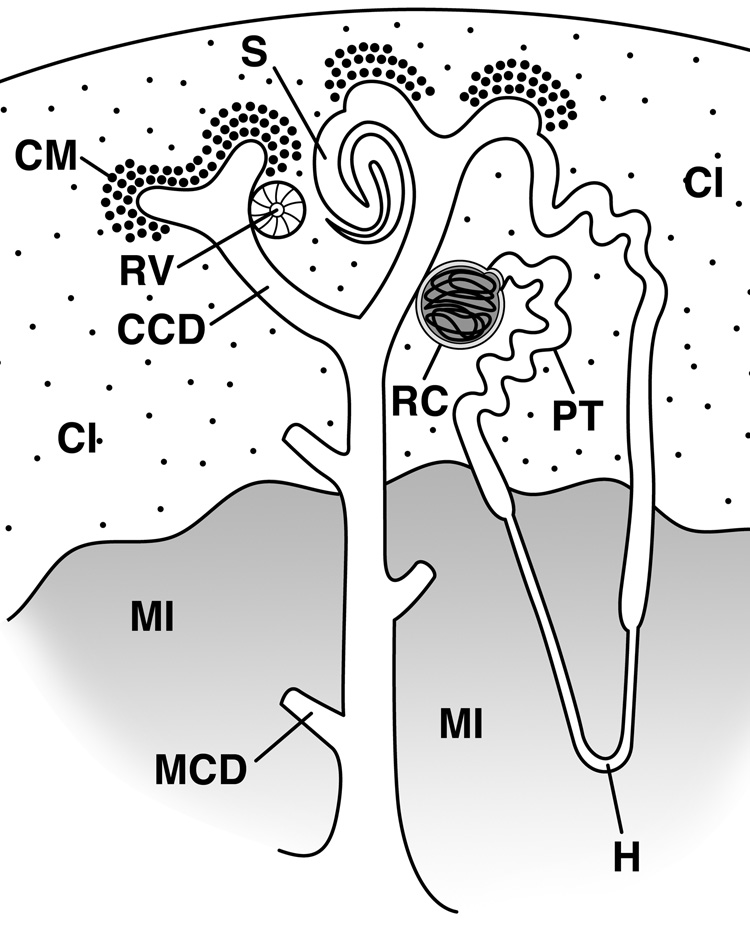
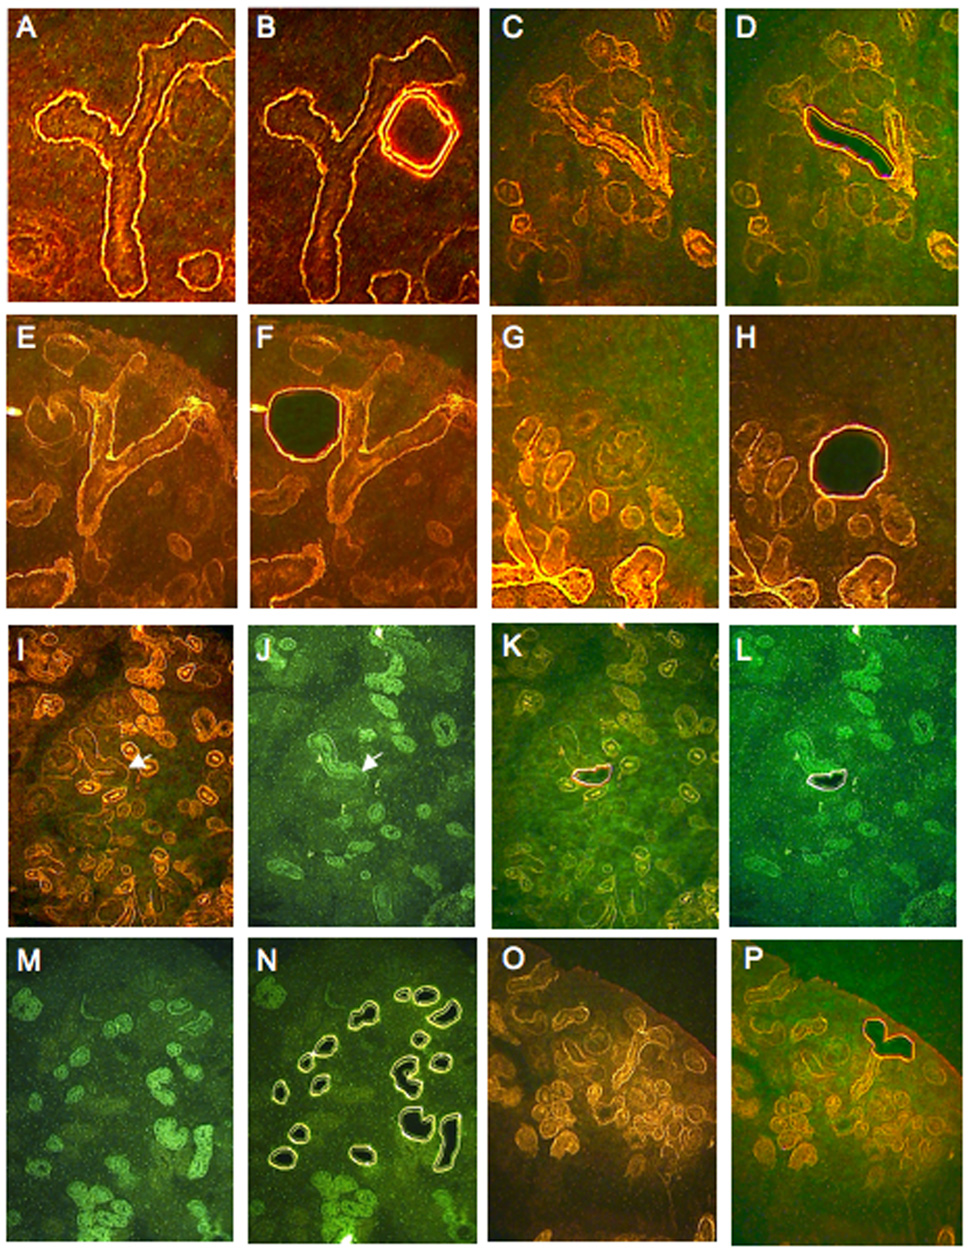
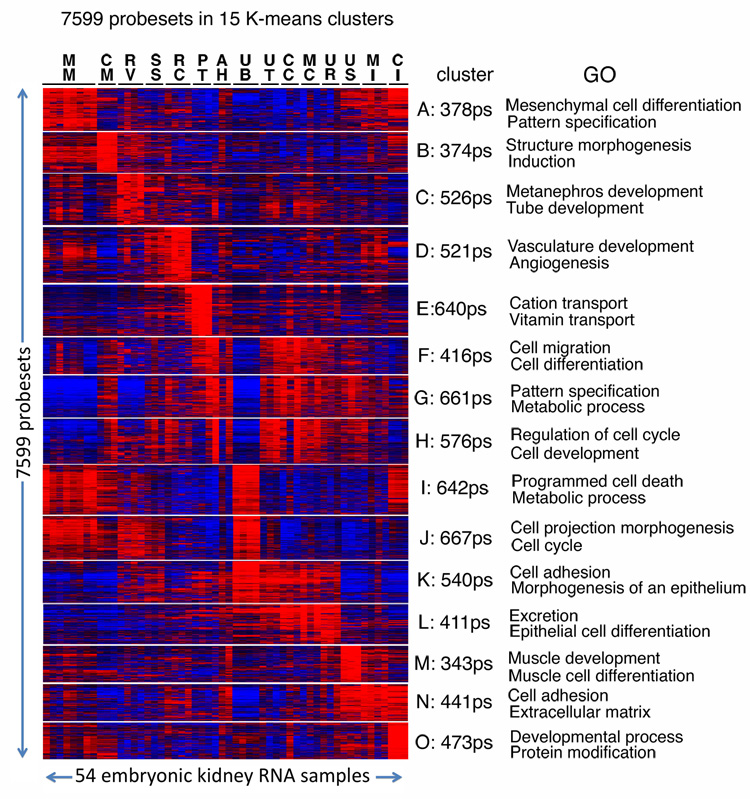
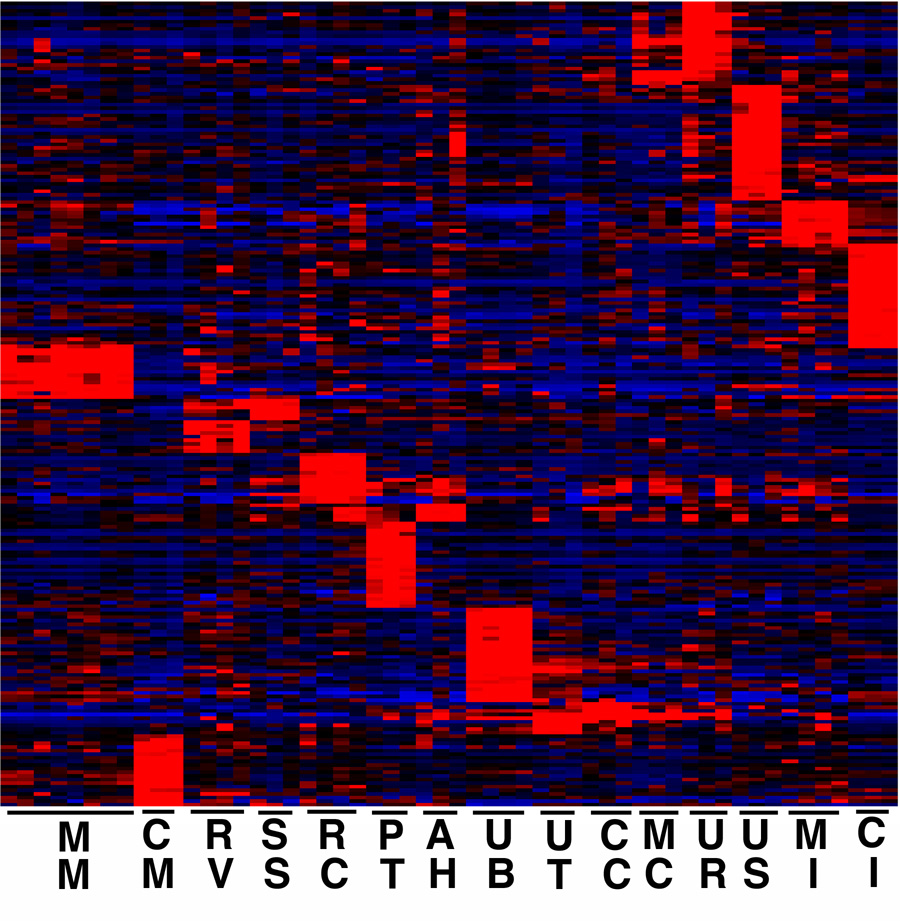
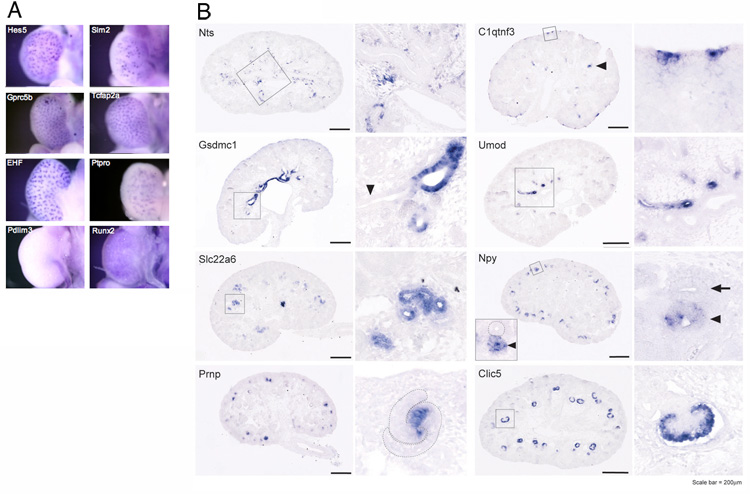
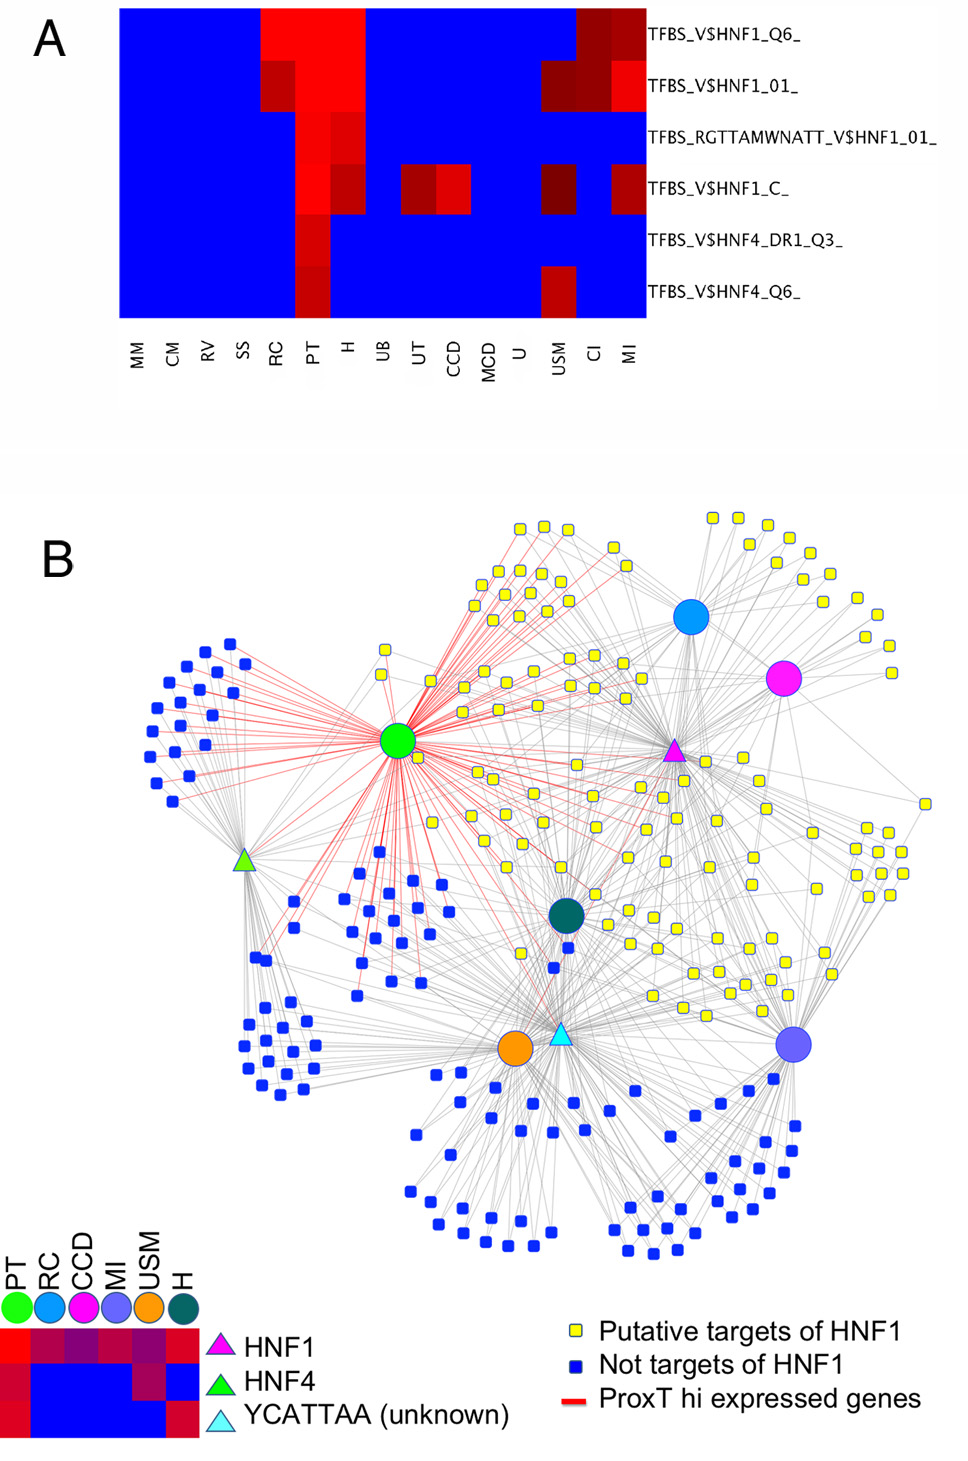
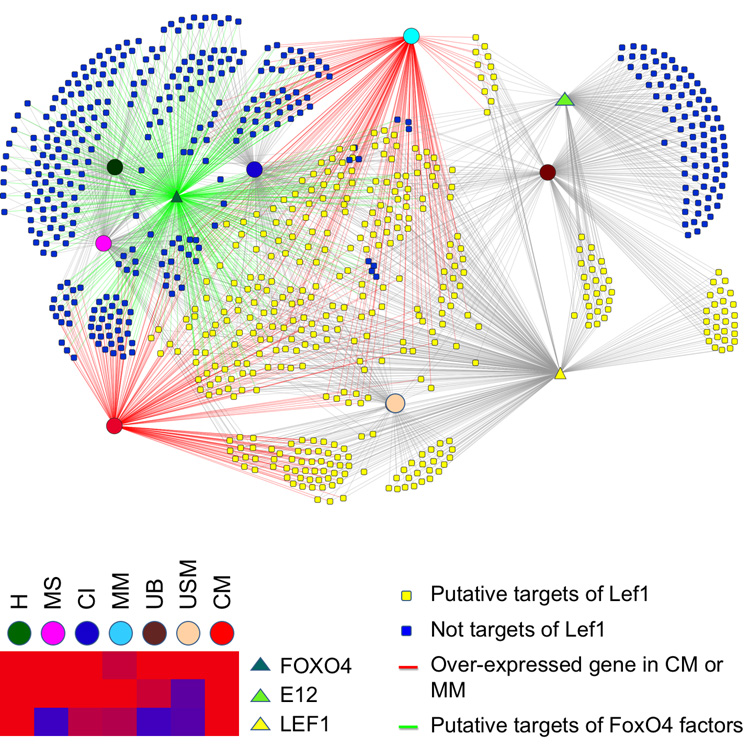
Kidney development is based on differential cell-type-specific expression of a vast number of genes. While multiple critical genes and pathways have been elucidated, a genome-wide analysis of gene expression within individual cellular and anatomic structures is lacking. Accomplishing this could provide significant new insights into fundamental developmental mechanisms such as mesenchymal-epithelial transition, inductive signaling, branching morphogenesis, and segmentation. We describe here a comprehensive gene expression atlas of the developing mouse kidney based on the isolation of each major compartment by either laser capture microdissection or fluorescence-activated cell sorting, followed by microarray profiling. The resulting data agree with known expression patterns and additional in situ hybridizations. This kidney atlas allows a comprehensive analysis of the progression of gene expression states during nephrogenesis, as well as discovery of potential growth factor-receptor interactions. In addition, the results provide deeper insight into the genetic regulatory mechanisms of kidney development.


Figures

Fig. 1
Fig. 1. Kidney development
The branching ureteric bud induces the cap mesenchyme (CM) to give rise to the renal vesicle (RV), which expands, folds, and fuses to the developing collecting duct to form the S-shaped body (S), which in turn gives rise to the renal corpuscle (RC) (glomerulus), early proximal tubule (PT), anlage of and immature loop of Henle (H) and distal tubule. The ureteric bud gives rise to the collecting duct, which can be divided into the medullary collecting duct (MCD), cortical collecting duct (CCD), and the ureteric tip region. In addition the interstitium (stromal cells) can be divided into the medullary interstitium (MI) and the cortical and nephrogenic interstitium (CI). Diagram modified from (Little et al., 2007).
Fig. 2
Fig. 2. Laser capture of kidney development components
(A) Y-shaped branching ureteric bud with underlying renal vesicle on the right side. (B) Laser cut surrounds renal vesicle. Branching ureteric bud (C) with cortical collecting duct region removed by laser capture (D). (E) Branching ureteric tip with underlying S-shaped body on left side. (F) Sshaped body removed by laser capture. (G,H) Renal corpuscle (glomerulus) removed by laser capture. (I) PNA stains epithelial structures of the cortex. (J) LTA specifically stains proximal tubules. (K,L) Isolation of anlage of loop of Henle. PNA only stained tubule, distal to region of tubule showing LTA staining, is removed by laser capture. (M,N) LTA stains proximal tubules, many of which are removed by laser capture. (O,P) Ureteric tree terminal branch, removed by laser capture. Panels A and B are E12.5 kidney, while all other panels are E15.5. Panels J, L, M and N are LTA stained while all others are PNA stained. For illustrations of laser capture of other components refer to GUDMAP.ORG.
Fig. 3
Fig. 3. Gene expression relationships of kidney development components
This heat map shows probesets with the most component specific expression. Each horizontal line represents a probeset, with red indicating high expression and blue indicating low expression in the various components. Compartments are: MM, E11.5 metanephric mesenchyme. CM, E15.5 cap mesenchyme. RV, E12.5 renal vesicle. SS, E15.5 S-shaped body. RC, E15.5 renal corpuscle. PT, E15.5 proximal tubules. AH, E15.5 Anlage of and immature loop of Henle. UB, E11.5 ureteric bud. UT, E15.5 ureteric tip region. CCD, E15.5 cortical collecting duct. MC, E15.5 medullary collecting duct. UR, E15.5 urothelium. US, ureteral smooth muscle layer. MI, medullary interstitium. CI, cortical and nephrogenic interstitium. Genes are divided into 15 K-means clusters. Two GO biological processes are shown for each cluster (P < 0.001). For complete lists of genes for each cluster and additional GO terms see Supplementary Materials.
Fig. 4
Fig. 4. Heat map of genes with most component specific expression
The top 223 genes with the most restricted expression patterns. Compartments are: MM, E11.5 metanephric mesenchyme. CM, E15.5 cap mesenchyme. RV, E12.5 renal vesicle. SS, E15.5 S-shaped body. RC, E15.5 renal corpuscle. PT, E15.5 proximal tubules. AH, E15.5 Anlage of and immature loop of Henle. UB, E11.5 ureteric bud. UT, E15.5 ureteric tip region. CCD, E15.5 cortical collecting duct. MC, E15.5 medullary collecting duct. UR, E15.5 urothelium. US, ureteral smooth muscle layer. MI, medullary interstitium. CI, cortical and nephrogenic interstitium. For gene lists with associated expression patterns see Supplementary Materials.
Fig. 5
Fig. 5. In situ hybridization validation of microarray results
E15.5 kidneys.A. Whole mount in situ hybridizations. Observed expression patterns are consistent with microarray results predicting strongest expression for Hes5 in S-shaped body and renal vesicle, Sim2 in S-shaped body, Gpcr5b in ureteric bud, Tcfap2a and EHF in ureteric bud, Ptpro in the renal corpuscle, Pdlim3 in the ureteral smooth muscle, and Runx2 in the cortical stroma. B. Section in situ hybridizations provide higher resolution. Each gene is represented by two images, a global view of the metanephric kidney and an enlarged high magnification image (the area magnified is outlined). The subcompartment the gene was identified as being enriched in, from the microarray analysis, is indicated in parentheses following the gene symbol. Nts (medullary interstitium) was expressed in the medullary interstitium in a specific region surrounding the collecting ducts, as well as in a subset of the cortical interstitium adjacent to the medulla, also surrounding the collecting ducts. C1qtnf3 (cortical and nephrogenic interstitium) was expressed in a small subset of the nephrogenic interstitium, the renal interstitium located within the nephrogenic zone of the metanephros, as well as in a small subset of cortical renal tubules (arrowhead). Gsdmc1, (also known as Mlze) (medullary collecting duct) was specifically expressed in the medullary collecting duct and expression was absent from the cortical collecting duct (arrowhead). Umod (anlage of and immature loop of Henle) was specifically expressed in the immature loop of Henle. Slc22a6 (early proximal tubule) was specifically expressed in the early proximal tubule. Npy (renal vesicle) was expressed in renal vesicles (arrowheads) and in the lower limb of comma-shaped bodies (the ureteric tip is indicated by an arrow or is outlined). Prnp (S-shaped body) was expressed in the medial segment of S-shaped bodies (outlined in the enlarged image) and in the upper limb of comma-shaped bodies. Clic5 (stage III-IV renal corpuscle) was specifically expressed in the visceral epithelium (podocyte layer) of stage III and IV renal corpuscles. Scale bar=200µm.
Fig. 6
Fig. 6. Occurrence of transcription factor binding sites in promoters of highly expressed genes
A. This heat map shows the very high frequency of HNF1 and HNF4α binding sites in the highly expressed genes of certain compartments. Red indicates high and blue shows low statistical significance. Four related defined binding sites were used for HNF1 and two for HNF4α. For example, P-values for V$HNF1_Q6_ were 10−4.9 for RC, 10−10 for PT, 10−6 for H, 10−2.3 for CI and 10−2.7 for MI, while not significant for any other compartment. This strongly suggests that HNF1 drives the expression sets of downstream target genes carrying promoter binding sites, in certain compartments. B. Diagram illustrating relationships of compartments (circles), transcription factors (triangles) and candidate target genes (squares). Lower left shows heat map of significance of binding sites in highly expressed genes in compartments, summing the data shown in panel A. Yellow squares are targets of HNF1, while blue are not. The overlapping set of targets expressed in multiple compartments is apparent. MM, E11.5 metanephric mesenchyme, CM, E15.5 cap mesenchyme, RV, E12.5 renal vesicle, S, E15.5 S-shaped body, RC E15.5 renal corpuscle (glomerulus), PT, E15.5 proximal tubules, H, E15.5 Loop of Henle and distal tubule, UB, E11.5 ureteric bud, UT, E15.5 tipregion of collecting ducts, CCD, E15.5 cortical collecting ducts, MCD, E15.5 medullary collecting duct, U, E15.5 urothelium, USM, E15.5 ureteral smooth muscle layer, CI, E15.5 cortical and nephrogenic interstitium (cortical stroma), MI, E15.5 medullary interstitium, (medullary stroma). YCATTAA is a conserved binding site for which the corresponding transcription factor is not yet known.
Fig. 7
Fig. 7. Compartment relationships of candidate Lef1 and Foxo4 target genes
Candidate target genes are associated with compartments with high expression (circles) and transcription factor (triangle) binding sites in promoters by lines. Genes in yellow are candidate Lef1 targets. Overlapping sets of compartment expression, and promoter combinatorial codes of TFBS contributing to some compartment specificity, are shown.

References

    1. Akpinar P, Kuwajima S, Krutzfeldt J, Stoffel M. Tmem27: a cleaved and shed plasma membrane protein that stimulates pancreatic beta cell proliferation. [see comment] Cell Metabolism. 2005;2:385–397. - PubMed
    1. Almeida M, Han L, Martin-Millan M, O'Brien CA, Manolagas SC. Oxidative stress antagonizes Wnt signaling in osteoblast precursors by diverting beta-catenin from T cell factor- to forkhead box O-mediated transcription. J Biol Chem. 2007;282:27298–27305. - PubMed
    1. Baumhueter S, Courtois G, Crabtree GR. A variant nuclear protein in dedifferentiated hepatoma cells binds to the same functional sequences in the beta fibrinogen gene promoter as HNF-1. EMBO Journal. 1988;7:2485–2493. - PMC - PubMed
    1. Benjamini Y, Hochberg Y. Controlling the False Discovery Rate: a practical and powerful approach to multiple testing. Journal of the Royal Statistical Society. 1995;57:289–300.
    1. Boyle S, Misfeldt A, Chandler KJ, Deal KK, Southard-Smith EM, Mortlock DP, Baldwin HS, de Caestecker M. Fate mapping using Cited1-CreERT2 mice demonstrates that the cap mesenchyme contains self-renewing progenitor cells and gives rise exclusively to nephronic epithelia. Developmental Biology. 2008;313:234–245. - PMC - PubMed

Publication types

LinkOut - more resources