. 2009 Feb 19;113(8):1689-98.
doi: 10.1182/blood-2008-03-147967. Epub 2008 Nov 10.

Notch signaling mediates G1/S cell-cycle progression in T cells via cyclin D3 and its dependent kinases

Affiliations

Notch signaling mediates G1/S cell-cycle progression in T cells via cyclin D3 and its dependent kinases

Ila Joshi et al. Blood. .

Abstract

Notch signaling plays a role in normal lymphocyte development and function. Activating Notch1-mutations, leading to aberrant downstream signaling, have been identified in human T-cell acute lymphoblastic leukemia (T-ALL). While this highlights the contribution of Notch signaling to T-ALL pathogenesis, the mechanisms by which Notch regulates proliferation and survival in normal and leukemic T cells are not fully understood. Our findings identify a role for Notch signaling in G(1)-S progression of cell cycle in T cells. Here we show that expression of the G(1) proteins, cyclin D3, CDK4, and CDK6, is Notch-dependent both in vitro and in vivo, and we outline a possible mechanism for the regulated expression of cyclin D3 in activated T cells via CSL (CBF-1, mammals; suppressor of hairless, Drosophila melanogaster; Lag-1, Caenorhabditis elegans), as well as a noncanonical Notch signaling pathway. While cyclin D3 expression contributes to cell-cycle progression in Notch-dependent human T-ALL cell lines, ectopic expression of CDK4 or CDK6 together with cyclin D3 shows partial rescue from gamma-secretase inhibitor (GSI)-induced G(1) arrest in these cell lines. Importantly, cyclin D3 and CDK4 are highly overexpressed in Notch-dependent T-cell lymphomas, justifying the combined use of cell-cycle inhibitors and GSI in treating human T-cell malignancies.


Figures
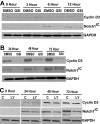
Figure 1
Figure 1
Cyclin D3 expression is dependent on Notch signaling in CD4+ T cells. (A) Whole cell lysates of CD4+ T cells were analyzed by immunoblotting for cyclin D3 or Notch1IC expression. CD4+ T cells were stimulated with 1 μg/mL anti-CD3ϵ and 1 μg/mL anti-CD28 for indicated time periods (0, 3, 6, and 12 hours) in the presence of GSI (IL-CHO, 50 μm) or DMSO (0.1%). (B) Later time points (24, 48, and 72 hours) after 1 μg/mL anti-CD3ϵ and 1 μg/mL anti-CD28 stimulation were analyzed for differences in cyclin D3 and Notch1IC expression with or without GSI treatment. (C) Whole cell lysates from stimulated CD4+ T cells (for 24, 48, and 72 hours) that were isolated from C57BL/6 mice treated in vivo with GSI for 14 days were analyzed for cyclin D3 and Notch1IC. GAPDH was used as a loading control. LY indicates GSI in rodent chow; and C, control rodent chow.
Figure 2
Figure 2
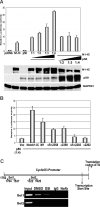
Expression from cyclin D3 promoter is regulated by Notch signaling. (A) CD4+ T cells after in vitro GSI pretreatment and from mice treated in vivo with GSI were stimulated with anti-CD3ϵ + anti-CD28 for 24 hours. Expression of cyclin D3 transcript was determined by RT-PCR after isolation of RNA. (B) Cyclin D3 luciferase reporter plasmid was transiently cotransfected with either 0.1 μg Notch1IC expression plasmid or 0.1 μg of indicated Notch1IC mutants into 293T cells. Transfected cells were harvested 48 hours later for dual luciferase assay. The relative luciferase activity was calculated by normalizing against Renilla luciferase (pRL-CMV) activity that was used as an internal control. Values shown are representative of 3 separate experiments performed in triplicate. (C) ChIP of stimulated CD4+ T cells with or without GSI treatment. Anti-Notch1 (left panels) and anti-CSL (right panels) were used to precipitate protein complexes bound to DNA. Rabbit isotype control IgG was used as a negative control. Primers sets 1 (top panels) and 2 (bottom panels) were used in PCR to determine whether Notch1 and CSL are recruited to a specific region on cyclin D3 promoter.
Figure 3
Figure 3
NF-κB binds to and augments Notch-dependent cyclin D3 promoter activity. (A) Cyclin D3 luciferase reporter plasmid (0.4 μg) and 0.1 μg pRL-CMV plasmid of internal control were transiently transfected into 293T cells. p50 and Notch1IC expression plasmids were cotransfected in ratios, as indicated, together with the reporter plasmids. Notch1IC was transfected in increasing amounts (0.1, 0.2, 0.3, and 0.4 μg) while the amount of p50 expression plasmid was kept constant (0.1 μg), and vice versa. Transfected cells were harvested 48 hours later for dual luciferase assay as previously described. Transfected cells were also harvested 48 hours later for whole cell lysates and immunoblotted for Notch-1 and p50. GAPDH was used as a loading control. (B) Cyclin D3 luciferase reporter plasmid was transiently cotransfected with either Notch1IC expression plasmid or Notch1IC mutants, as indicated, along with the p50 expression plasmid in 4:1 ratios (0.4 μg Notch1IC:0.1 μg p50) into 293T cells. Transfected cells were harvested 48 hours later for dual luciferase assay. Values shown for both luciferase assays are representative of 3 separate experiments carried out in triplicate. (C) ChIP of stimulated CD4+ T cells with or without GSI treatment (as described in “Methods”). Anti-p50 was used to precipitate protein complexes bound to DNA. Goat isotype control IgG was used as a negative control. Two different primer sets (1 and 2) were used to assess specificity of binding of p50 to the cyclin D3 promoter via PCR of immunoprecipitated DNA fractions. Results shown are representative of at least 3 separate experiments.
Figure 4
Figure 4
Cyclin D3 is a target of Notch signaling in human T-ALL cell lines. (A) Cell-cycle analysis was performed on human T-ALL cell lines DND-41, HPB-ALL, and T-ALL1 that were treated with 0.1% DMSO (top panels) or GSI, 3 μm IL-CHO (bottom panels) for 7 days. FACS plots are representative of results of 3 independent replicates. Graphical representation of the mean (± SE) of percentage of cells in G1 phase of cell cycle under the 2 treatment conditions for the 3 experiments conducted. Two-tailed Student t tests were performed using GraphPad Prism version 4.0 for OS X (GraphPad Software, San Diego, CA) **P < .05.. (B) Whole cell extracts were prepared from human T-ALL cell lines after 7 days of GSI or DMSO treatment to analyze difference in cyclin D3 (top) and Notch1 expression (middle). GAPDH (bottom) was used as a loading control. (C) Graphical representation of relative G1 rescue indices. Human T-ALL cell lines were retrovirally infected with either MSCV-IRES-YFP (vector, open bar) or MSCV-cyclin D3-IRES-YFP (cyclin D3, solid bar). Infected cells were sorted for enrichment and treated with DMSO or GSI for 7 days. Cell-cycle analysis was performed to determine the percentage of cells arrested in G1 with GSI-treatment, compared with DMSO. Relative G1 rescue indices were calculated for each cell line after normalizing against GSI-induced G1 arrest in the uninfected cell line.
Figure 5
Figure 5
CDK4 and CDK6 expression and pRb phosphorylation is dependent on Notch signaling in CD4+ T cells. (A) Whole cell lysate of CD4+ T cells that were stimulated as described before for indicated time points (0, 3, 6, and 12 hours) in the presence (in vitro) of GSI or DMSO were analyzed by immunoblotting for differences in CDK4 and CDK6 expression. (B) Whole cell lysates of CD4+ T cells that had been stimulated, as described, for indicated time points (24, 48, and 72 hours) in the presence (in vitro) of GSI or DMSO were analyzed by immunoblotting for differences in CDK4 and CDK6 expression. Changes in temporal expression of CDK4 and CDK6 after stimulation are represented graphically in lower panels. (C) Nuclear lysates from in vitro GSI- or DMSO-treated CD4+ T cells that were stimulated for 24, 48, and 72 hours were analyzed by immunoblotting for differences in pRb phosphorylation at residues Ser780 (top panel) and Ser795 (bottom panel). The nuclear protein PARP was used as a loading control.
Figure 6
Figure 6
CDK4 and CDK6 expression and pRb phosphorylation are targets of Notch signaling in human T-ALL cell lines. (A) Whole cell extracts were prepared from human T-ALL cell lines after 7 days of in vitro GSI or DMSO treatment to analyze differences in CDK4 (top) and CDK6 expression (middle). GAPDH (bottom) was used as a loading control. Band intensities of protein expression were normalized to GAPDH and represented graphically using ImageJ software, version 1.31, supported by Wayne Rasband (NIH). (B) Immunoblot of whole-cell lysates prepared from human T-ALL cell lines that were treated with GSI or DMSO for 7 days to analyze differences in pRb phosphorylation, pRB Ser780 (top panels), pRb Ser795 (middle panels), and GAPDH (bottom panels; loading control). (C) Graphical representation of relative G1 rescue indices. Human T-ALL cell lines DND-41, HPB-ALL, and T-ALL1 were retrovirally infected either with MSCV-IRES-YFP and MSCV-IRES-DsRed II (vector, black bar), MSCV-cyclin D3-IRES-YFP and MSCV-CDK4-IRES-DSRed (CDK4 + D3, gray bar), or MSCV-cyclin D3-IRES-YFP and MSCV-CDK6-IRES-DSRed (CDK6 + D3, white bar). The infected cells were sorted for enrichment and treated with DMSO or GSI for 7 days. Cell-cycle analysis was performed to determine the percentage of cells arrested in G1 with GSI treatment compared with DMSO. Relative G1 rescue indices were calculated for each cell line after normalizing against the GSI-induced G1 arrest in the uninfected cell line.
Figure 7
Figure 7
Regulation of cyclin D3 and CDK4 expression by Notch1 in T-cell lymphomas. (A) Protein extract from spleens of 2 wild-type FVB mice (WT) and 3 Top-Notch leukemic (tTA-Nic) mice were used to analyze the expression of cyclin D3, CDK4, and Notch-1. GAPDH was used as a loading control. (B) Protein extracts from spleens of 2 wild-type FVB mice (WT) and 2 MIG-Nic leukemic mice were used to determine cyclin D3, CDK4, and Notch-1 expression, as indicated. GAPDH was used as a loading control. (C) E μ-tTA/TOP-Notch mice were generated as previously described., Samples prepared for regression analysis were prepared as described in Table S1. Left panel shows the RT-PCR performed on primary tumor samples and on transplanted samples from mice undergoing doxycycline regression for different lengths of time (0, 3, and 24 hours). Notch transcripts were analyzed, and β-actin was used as a positive control. Right panel shows Western blot analysis performed using total cell lysate for detection of cyclin D3 and CDK4 from primary tumor samples and transplanted samples from mice undergoing doxycycline regression for various lengths of time (0 and 24 hours).

Comment in

  • Another Notch on the belt.
    Schnapp LM. Schnapp LM. Blood. 2009 Feb 19;113(8):1615-6. doi: 10.1182/blood-2008-12-192815. Blood. 2009. PMID: 19228927 No abstract available.

Similar articles

Cited by

References

    1. Artavanis-Tsakonas S, Rand MD, Lake RJ. Notch signaling: cell fate control and signal integration in development. Science. 1999;284:770–776. - PubMed
    1. Radtke F, Wilson A, Mancini SJC, MacDonald HR. Notch regulation of lymphocyte development and function. Nat Immunol. 2004;5:247–253. - PubMed
    1. Maillard I, Fang T, Pear WS. Regulation of lymphoid development, differentiation, and function by the Notch pathway. Annu Rev Immunol. 2005;23:945–974. - PubMed
    1. Aster JC. Deregulated NOTCH signaling in acute T-cell lymphoblastic leukemia/lymphoma: new insights, questions, and opportunities. Int J Hematol. 2005;82:295–301. - PubMed
    1. Grabher C, von Boehmer H, Look AT. Notch 1 activation in the molecular pathogenesis of T-cell acute lymphoblastic leukaemia. Nat Rev Cancer. 2006;6:347–359. - PubMed

Publication types

MeSH terms