. 2009 Jan 9;284(2):1018-30.
doi: 10.1074/jbc.M807823200. Epub 2008 Nov 9.

Cadherin switching and activation of beta-catenin signaling underlie proinvasive actions of calcitonin-calcitonin receptor axis in prostate cancer

Affiliations

Cadherin switching and activation of beta-catenin signaling underlie proinvasive actions of calcitonin-calcitonin receptor axis in prostate cancer

Girish V Shah et al. J Biol Chem. .

Abstract

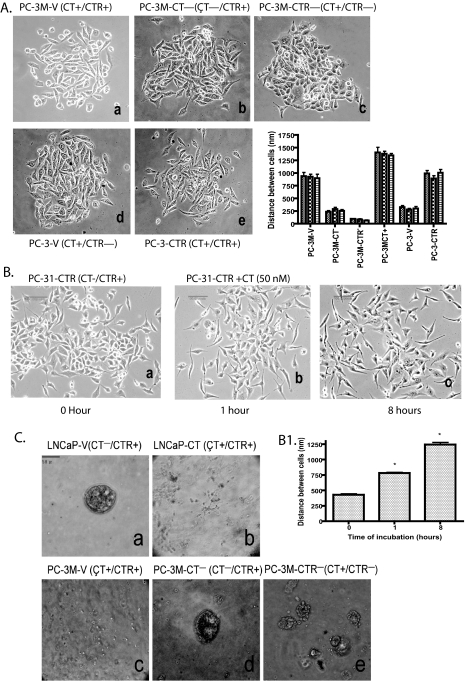
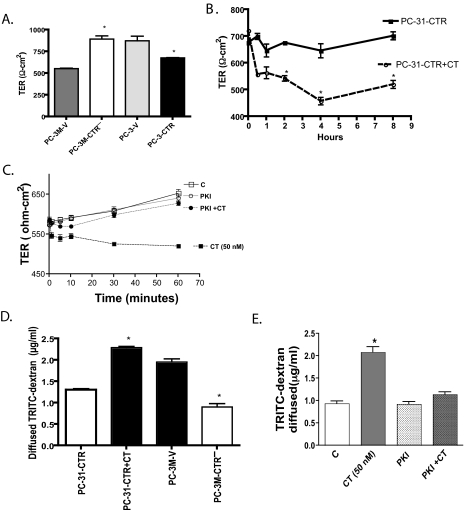
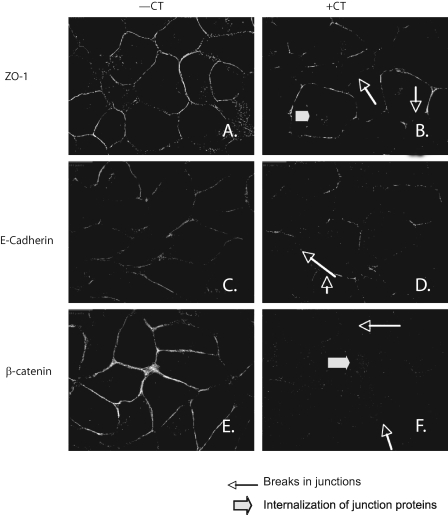
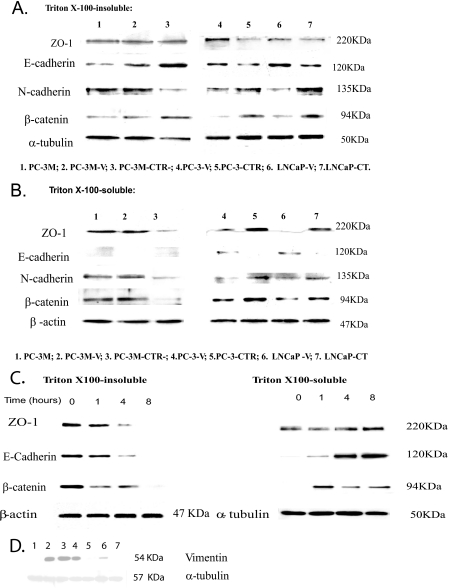
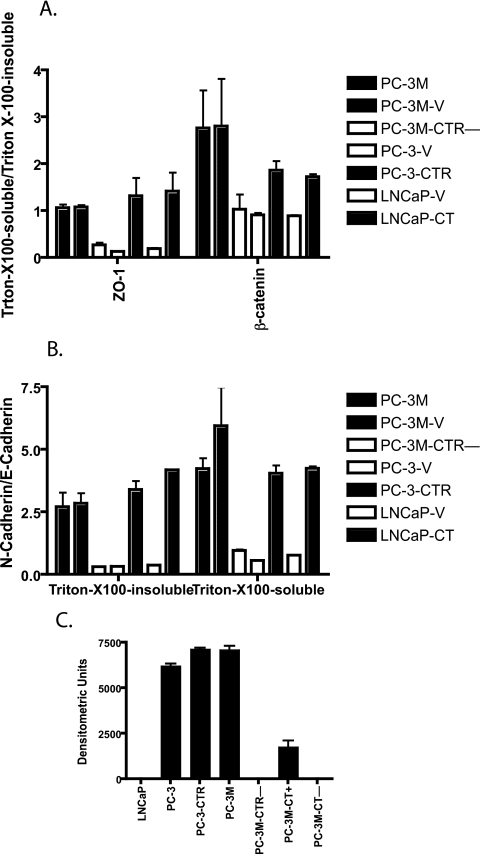
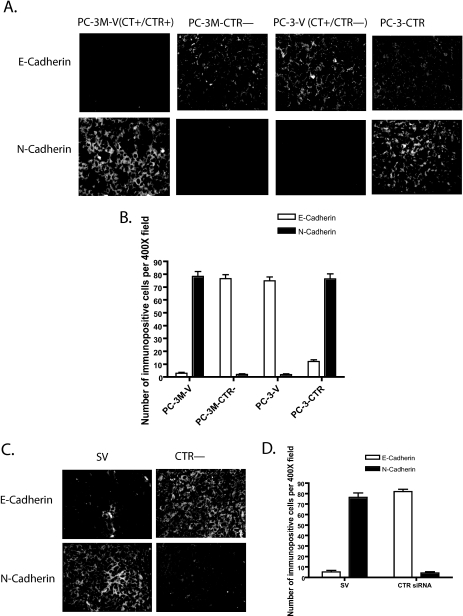
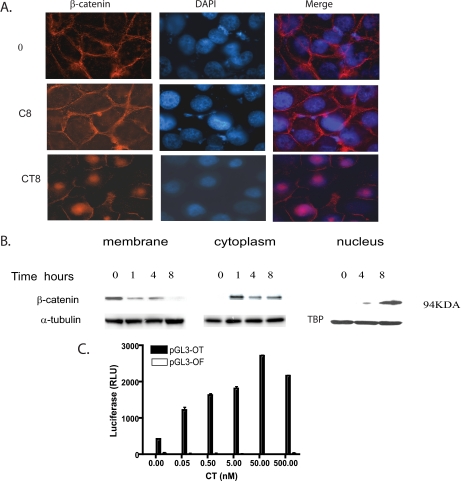
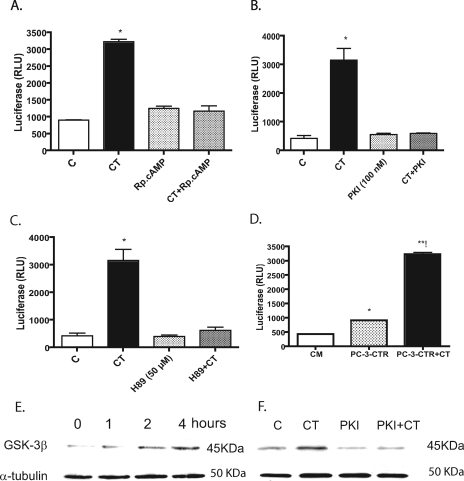
Calcitonin, a neuroendocrine peptide, and its receptor are localized in the basal epithelium of benign prostate but in the secretory epithelium of malignant prostates. The abundance of calcitonin and calcitonin receptor mRNA displays positive correlation with the Gleason grade of primary prostate cancers. Moreover, calcitonin increases tumorigenicity and invasiveness of multiple prostate cancer cell lines by cyclic AMP-dependent protein kinase-mediated actions. These actions include increased secretion of matrix metalloproteinases and urokinase-type plasminogen activator and an increase in prostate cancer cell invasion. Activation of calcitonin-calcitonin receptor autocrine loop in prostate cancer cell lines led to the loss of cell-cell adhesion, destabilization of tight and adherens junctions, and internalization of key integral membrane proteins. In addition, the activation of calcitonin-calcitonin receptor axis induced epithelial-mesenchymal transition of prostate cancer cells as characterized by cadherin switch and the expression of the mesenchymal marker, vimentin. The activated calcitonin receptor phosphorylated glycogen synthase kinase-3, a key regulator of cytosolic beta-catenin degradation within the WNT signaling pathway. This resulted in the accumulation of intracellular beta-catenin, its translocation in the nucleus, and transactivation of beta-catenin-responsive genes. These results for the first time identify actions of calcitonin-calcitonin receptor axis on prostate cancer cells that lead to the destabilization of cell-cell junctions, epithelial-to-mesenchymal transition, and activation of WNT/beta-catenin signaling. The results also suggest that cyclic AMP-dependent protein kinase plays a key role in calcitonin receptor-induced destabilization of cell-cell junctions and activation of WNT-beta-catenin signaling.


Figures

FIGURE 1.
FIGURE 1.
CT-CTR axis and cell-cell adhesion. A, phase contrast micrographs (×100) of subconfluent PC lines show changes in cell-cell compaction pattern caused by modulation of CT/CTR expression. Panel a, empty vector transfected PC-3M cells (PC-3M-V); panel b, CT down-regulated PC-3M cells (PC-3M-CT-); panel c, CTR down-regulated PC-3M cells (PC-3M-CTR-); panel d, PC-3 cells transfected with empty vector (PC-3-V); panel e, PC-3 cells with enforced CTR (PC-3-CTR); panel f, distance between cells of three different clones of each cell lines in a–e is expressed as nm ± S.E. for n = 20. *, p < 0.001; two-way ANOVA (active CT-CTR axis versus inactive CT-CTR axis). B, phase contrast micrographs (×100) of subconfluent cultures of PC-31-CTR cells treated acutely with 50 nm CT for different time periods. PC-3-CTR cell cultures were photographed after treatment with 50 nm for panel a, 0 min; panel b, 1 h; and panel c, 8 h. B1 presents the mean inter-cell distance nm ± S.E. at each time point for n = 36. *, p < 0.005; one-way ANOVA and Newman-Keuls test. C, PC cells were seeded on collagen in acinus medium as described under “Experimental Procedures.” Phase contrast images (×100) of acinar structures were captured on the 14th day. Panel a, LNCaP vector controls (LNCaP-V); panel b, LNCaP cells with enforced CT expression (LNCaP-CT); panel c, PC-3M vector controls (PC-3M-V); panel d, CT down-regulated PC-3M cells (PC-3M-CT-); panel e, CTR down-regulated PC-3M cells (PC-3M-CTR-).
FIGURE 2.
FIGURE 2.
Effect of CT-CTR axis on TER and paracellular permeability. A, monolayers of PC-3M-V, PC-3M-CTR-, PC-3-V, and PC-3-CTR cells were allowed to polarize, and TER values were measured 3 days after plating. Results are mean TER ± S.E. (n = 3). Data were compiled from three separate experiments. *, p < 0.05 significantly different from their respective controls (one-way ANOVA and Newman-Keuls test). B, monolayer cultures of PC-31-CTR cells were exposed to 50 nm CT 24 h after plating. TER values were measured from 5 min to 8 h after CT treatments. Results are mean TER ± S.E. (n = 3) normalized to control monolayers of PC-31-CTR cells at each time point. Data were compiled from three separate experiments. *, p < 0.05 significantly different from their respective controls (one-way ANOVA and Newman-Keuls test). C, polarized PC-31-CTR cells on transwells were treated with vehicle, CT (50 nm), m-PKI (100 nm), or m-PKI+CT. Their TER was measured at several time points after the addition of agents. D, polarized monolayer cultures of PC-3M-V, PC-3M-CTR-, PC-31-CTR, and PC-31-CTR cells treated with 50 nm CT for 4 h. The cells were then treated with TRITC-dextran (500 μl of 1 mg/ml solution) in the upper chamber. After 1 h, 100 μl of media was drawn from the lower chamber and assayed for fluorescence using spectrophotometer at 530 nm excitation and 590 nm emission. *, p < 0.05 significantly different from their respective controls (one-way ANOVA and Newman-Keuls test). E, polarized PC-31-CTR cells on transwells were treated with vehicle, CT (50 nm), m-PKI (100 nm), or m-PKI+CT. Their paracellular permeability was determined by diffusion of TRITC-dextran after 1 h incubation with the agents. The results are expressed as mean ± S.E. (n = 4). *, p < 0.05 significantly different from control (one-way ANOVA and Newman-Keuls test).
FIGURE 3.
FIGURE 3.
Localization of junctional proteins by immunofluorescence. Confluent monolayer of PC-31-CTR cells grown on Transwell filters were allowed to polarize for 4 days. The cells were then treated with 50 nm CT for 60 min and fixed with methanol at -20 °C for 10 min. After immunofluorescent staining for ZO-1, E-cadherin, and β-catenin, ×400 pictures were captured. The focus was adjusted to the basolateral plane. Left panels present vehicle-treated cells; and right panels present cells treated with CT.
FIGURE 4.
FIGURE 4.
Localization of junctional proteins, immunoblotting. Confluent monolayers of PC sublines were lysed with cytosolic lysis buffer for 30 min to collect Triton X-100-soluble fraction. Then the cells were lysed in membrane lysis buffer to obtain Triton X-100-insoluble fraction. Western blot analysis for ZO-1, E-cadherin, N-cadherin, and β-catenin was carried out after loading 40 μg of Triton X-100-soluble proteins and 20 μg of Triton X-100-insoluble proteins. β-Actin and α-tubulin were respective loading controls. The experiment was repeated three separate times. A, Western blot of junction proteins in Triton X-100-insoluble fraction. B, Western blot of junction proteins in Triton X-100-soluble fraction. C, Western blot of junction proteins in Triton X-100-insoluble and Triton X-100-souble fractions after acute stimulation of PC-31 cells with CT. Confluent monolayers of PC-31-CTR cell were serum-starved and treated with 50 nm CT for periods of 1, 4, and 8 h. Cells were first treated with cytosolic lysis buffer for 30 min to collect cytosolic fraction. Then the cells were lysed in membrane lysis buffer. Western blot analysis for ZO-1, E-cadherin, and β-catenin was carried out after loading 40 μg of cytosolic proteins and 20 μg of membrane proteins. α-Tubulin and β-actin were respective loading controls. The experiment was repeated three separate times. D, Western blot of vimentin immunoreactivity in PC cell lines. Confluent monolayers of PC sublines were lysed and subjected to SDS-PAGE and Western blot analysis as described under “Experimental Procedures” after loading 80 μg of lysate proteins. α-Tubulin was the loading control. The experiment was repeated three separate times. Lane 1, LNCaP; lane 2, PC-3-CTR; lane 3, PC-3M; lane 4, PC-3M-CT+; lane 5, PC-3M-CTR-; lane 6, PC-3; lane 7, PC-3M-CT-.
FIGURE 5.
FIGURE 5.
Densitometric quantitation of blots of Fig. 4. The developed immunoblots were scanned on a Bio-Rad densitometer. The data from three blots were pooled and presented as means ± S.E. for n = 3. A, quantitation of Western blots in Fig. 4, A and B, presented as a ratio of Triton X-100-soluble/Triton X-100-insoluble levels of ZO-1 and β-catenin. B, quantitation of Western blots in Fig. 4, A and B, presented as a ratio of N-cadherin/E-cadherin. C, quantitation of vimentin blots of Fig. 4D.
FIGURE 6.
FIGURE 6.
Immunofluorescence of E- and N-cadherin in tumor xenografts. E-cadherin- and N-cadherin-immunopositive cells in the tumor were identified by immunofluorescence in two sets of xenografts. A, xenografts of PC-3M-V, PC-3M-CTR-, PC-3-V, and PC-3-CTR cell lines were probed for E-cadherin and N-cadherin immunoreactivity (4 sections/xenograft). Six ×400 micrographs (per each specimen) were captured from tumor xenografts of four different animals. B, number of immunopositive cells and total cells (DAPI-positive) in each micrograph were counted. The results are presented as mean ± S.E. (n = 24). C, mice bearing PC-3M xenografts were treated with the vector expressing either scrambled siRNA (SV) or CTR siRNA (CTR-) as described in earlier studies (25). Four sections of each of these xenografts were probed for E-cadherin and N-cadherin immunoreactivity. Six ×400 micrographs were captured from tumor xenografts of four different animals. D, number of immunopositive cells and total cells (DAPI-positive) in each micrograph were counted. The results are presented as mean ± S.E. (n = 24).
FIGURE 7.
FIGURE 7.
Effect of CT-CTR axis on β-catenin translocation. A, confluent monolayer of PC-31-CTR cells grown on transwell filters were allowed to polarize for 4 days. Serum-starved cells were treated with 50 nm CT for 8 h and fixed with methanol at -20 °C for 10 min. After immunostaining for β-catenin, pictures were captured at ×400. Top and middle panels show β-catenin localization in the membrane of PC-31-CTR treated with vehicle at 0 h (0) and 8 h (C8), respectively, whereas the bottom panel shows β-catenin translocated to the nucleus of PC-31-CTR cells when treated with CT for 8 h (CT8). B, effect of CT on β-catenin translocation. Confluent monolayers of PC-31 CTR cells were serum-starved and then treated with 50 nm of CT for periods of 0, 1, 4, and 8 h. Cells were first treated with cytosolic lysis buffer for 30 min to collect Triton X-100-soluble fraction. Then the remainder of the cells was treated with membrane lysis buffer to obtain Triton X-100-insoluble buffer. Nuclear fraction was extracted from four separate plates treated with CT for periods of 0, 4, and 8 h. Western blot analysis for β-catenin was carried out after loading 40 μg of cytosolic proteins and 20 μg of membrane and nuclear proteins. α-;tubulin, β-actin, and TATA-binding protein (TBP) were loading controls for membrane, cytoplasmic, and nuclear fractions, respectively. The experiment was repeated three separate times. C, effect of CT on TCF/LEF promoter activity. PC-31-CTR cells were seeded into 6-well plates and transfected with the pGL3-OT-luciferase/pRL-TK plasmids or pGL3-OF-luciferase/pRL-TK plasmids. The cells were then incubated in complete medium for 48 h, after which they were serum-starved for 16 h. The cells were then treated with various concentrations of CT (0–500 nm) for 8 h. The lysates were analyzed for luciferase activity. The results are expressed relative light units (RLU) after normalization with Renilla luciferase activity. The experiment was repeated three separate times. The results are expressed as means ± S.E.
FIGURE 8.
FIGURE 8.
Role for PKA in CT-stimulated transactivation of TCF/LEF promoter activity and GSK3β phosphorylation. A, PC-31-CTR cells were seeded into 6-well plates and transfected with the pGL3-OT-luciferase and pRL-TK plasmids. The cells were then cultured in complete medium for 48 h, after which they were serum-starved for 16 h. The cells were then treated with either vehicle (C), 50 nm CT (CT), PKA inhibitor (Rp)-cAMP (Rp-cAMP) (1 mm), or 1 mm (Rp)-cAMP + 50 nm CT (CT+Rp-cAMP) for 8 h. The lysates were analyzed for luciferase activity. The results are expressed relative light units (RLU) after normalization with Renilla luciferase activity. The experiment was repeated three separate times. The results are expressed as mean ± S.E. *, p < 0.05 (one-way ANOVA and Newman-Keuls test). B, same as A except (Rp)-cAMP was replaced with another specific PKA inhibitor m-PKI (200 nm). C, same as A, except (Rp)-cAMP was replaced with PKA inhibitor H89 (3 μm). D, conditioned medium of CT-stimulated PC-3-CTR cells activates TCF-mediated transcription. PC-31-CTR cells were seeded into 6-well plates and transfected with the pGL3-OT-luciferase and pRL-TK plasmids. The cells were then cultured in complete medium for 48 h, after which they were serum-starved for 16 h. The cells were then incubated either with control medium (CM) or with the conditioned media harvested from 48-h cultured PC-31-CTR cells treated without/with 50 nm CT. The mean fold induction of five independent experiments is shown. *, p < 0.05 by Student's t test. E, PC-31-CTR cells were treated with 50 nm CT for 0, 1, 2, and 4 h. The cell lysates were collected. Western blot analysis for phopho-GSK-3β was carried out after loading 40 μg of total protein/lane. α-Tubulin was used as loading control. The experiment was repeated three separate times. F, PC-31-CTR cells were treated with vehicle (C), 50 nm CT (CT), 2 μm m-PKI (PKI), and with 2 μm m-PKI + 50 nm CT (PKI+CT) for 4 h. Western blot analysis for phospho-GSK-3β was carried out after loading 40 μg of protein collected from each treatment group. α-Tubulin was used as loading controls. The experiment was repeated three separate times.

Similar articles

Cited by

References

    1. Presti, J. C., Jr. (2000) Radiol. Clin. North Am. 38 49-58 - PubMed
    1. Thompson, I. M., Pauler, D. K., Goodman, P. J., Tangen, C. M., Lucia, M. S., Parnes, H. L., Minasian, L. M., Ford, L. G., Lippman, S. M., Crawford, E. D., Crowley, J. J., and Coltman, C. A., Jr. (2004) N. Engl. J. Med. 350 2239-2246 - PubMed
    1. Segawa, N., Mori, I., Utsunomiya, H., Nakamura, M., Nakamura, Y., Shan, L., Kakudo, K., and Katsuoka, Y. (2001) Pathol. Int. 51 452-459 - PubMed
    1. Chien, J., Ren, Y., Qing Wang, Y., Bordelon, W., Thompson, E., Davis, R., Rayford, W., and Shah, G. (2001) Mol. Cell. Endocrinol. 181 69-79 - PubMed
    1. Furuya, Y., Akakura, K., Akimoto, S., Inomiya, H., and Ito, H. (1999) Int. J. Urol. 6 240-244 - PubMed

Publication types

MeSH terms