. 2009 Jan 2;284(1):46-55.
doi: 10.1074/jbc.M806311200. Epub 2008 Nov 10.

Denervation induces cytosolic phospholipase A2-mediated fatty acid hydroperoxide generation by muscle mitochondria

Affiliations

Denervation induces cytosolic phospholipase A2-mediated fatty acid hydroperoxide generation by muscle mitochondria

Arunabh Bhattacharya et al. J Biol Chem. .

Abstract

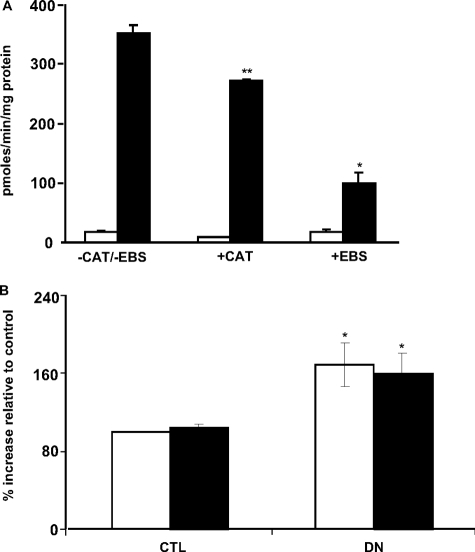
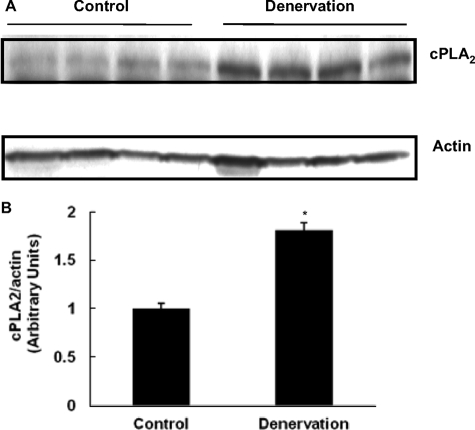
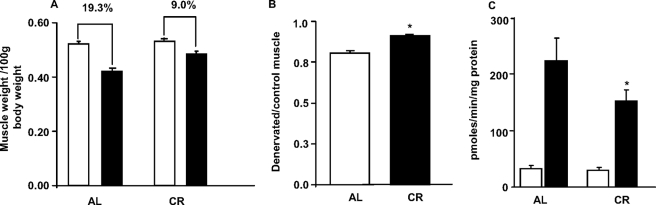
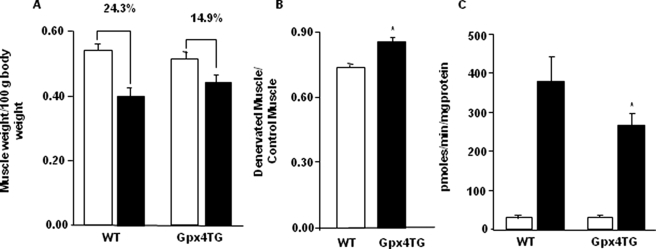
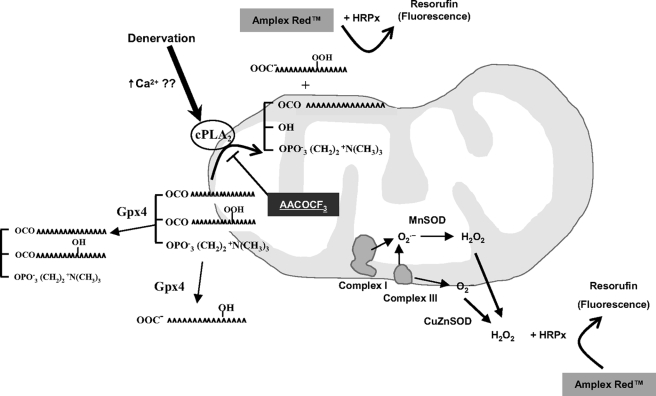
Previously, we demonstrated that mitochondria from denervated muscle exhibited dramatically higher Amplex Red dependent fluorescence (thought to be highly specific for hydrogen peroxide) compared with control muscle mitochondria. We now demonstrate that catalase only partially inhibits the Amplex Red signal in mitochondria from denervated muscle. In contrast, ebselen (a glutathione peroxidase mimetic and inhibitor of fatty acid hydroperoxides) significantly inhibits the Amplex Red signal. This suggests that the majority of the Amplex Red signal in mitochondria from denervated muscle is not derived from hydrogen peroxide. Because Amplex Red cannot react with substrates in the lipid environment, we hypothesize that lipid hydroperoxides formed within the mitochondrial lipid bilayer are released as fatty acid hydroperoxides and react with the Amplex Red probe. We also suggest that the release of fatty acid hydroperoxides from denervated muscle mitochondria may be an important determinant of muscle atrophy. In support of this, muscle atrophy and the Amplex Red signal are inhibited in caloric restricted mice and in transgenic mice that overexpress the lipid hydroperoxide-detoxifying enzyme glutathione peroxidase 4. Finally, we propose that cytosolic phospholipase A2 may be a potential source of these hydroperoxides.


Figures

FIGURE 1.
FIGURE 1.
CAT partially inhibits the Amplex Red signal in mitochondria from denervated muscle. The Amplex Red assay was performed in the absence/presence of catalase and/or respiratory substrates (glutamate/malate (G/M), 5 mm; succinate (S), 10 mm) and inhibitors (rotenone (R), antimycin A (AA), 0.5 μm). Catalase significantly inhibited but did not completely remove the Amplex Red signal in mitochondria isolated from denervated muscle in the absence (State 1) and in the presence of respiratory substrates (glutamate/malate and succinate/rotenone). Statistical significance was based on the difference in Amplex Red signal in the absence (–) and presence (+) of catalase in mitochondria isolated from denervated muscle within each experimental condition (*, p < 0.001; **, p < 0.05; ***, p < 0.01) by one-way ANOVA with Newman Keul's multiple comparison test. The results are the means ± S.E. of 13–14 experiments (control, white bars; denervated (–catalase), black bars; denervated (+catalase), gray bars).
FIGURE 2.
FIGURE 2.
A and B, the superoxide signal was unaltered in mitochondria from control and denervated muscle by EPR. A shows the EPR traces of DIPPMPO-measured superoxide release from skeletal muscle mitochondria in the absence (State 1) and presence of respiratory substrate, glutamate/malate (G/M) (5 mm). Each trace shows the average of four independent animals, with 10 scans performed for each. The quantified data are presented (n = 4–5, mean ± S.E.) in Fig. 2B (control (CTL), white bar; denervated (DN), black bars). C, aconitase activity does not change with denervation. Muscle homogenate (0.5 mg of protein/ml) was incubated with buffers (with or without isocitrate dehydrogenase), and aconitase activity was measured at 355-nm excitation and 460-nm emission. The difference in fluorescence reading in the presence/absence of isocitrate dehydrogenase was taken as a measure of aconitase activity. The results are expressed as the means ± S.E. of 4–5 experiments (control, white bar; denervated, black bar). D, no difference in superoxide release in mitochondria from control and denervated muscles by the MCLA probe. Mitochondria isolated from control and denervated muscles were incubated in the presence of MCLA, and fluorescence was measured at ∼465 nm. The MCLA signal was undetectable in mitochondria isolated from control and denervated muscle in the absence of respiratory substrates (State 1). No difference in the MCLA signal was detected in the presence of respiratory substrate, glutamate/malate. The results are expressed as the means ± S.E. of nine experiments (control, white bars; denervated, black bars).
FIGURE 3.
FIGURE 3.
Amplex Red probe reacts with organic/fatty acid hydroperoxides besides hydrogen peroxide. Fig. 3 shows the dose response (0–2,500 pmol) when hydrogen peroxide (A) and the hydroperoxides, t-BHP (open triangle) and 15HpETE (closed triangle) were incubated with the Amplex Red probe (B), and end point measurements were made. Both 15HpETE and t-BHP increased the Amplex Red signal in a dose-dependent manner but at levels much lower than with H2O2.
FIGURE 4.
FIGURE 4.
A, ebselen inhibits mitochondrial State 1 Amplex Red signal in mitochondria from denervated muscle. Amplex Red signal was measured in mitochondria from control (CTL) and denervated (DN) muscle in the presence of 10 μm ebselen (EBS) or 4 units of catalase. The values are the means ± S.E. for three experiments. Statistical significance was based on the difference in Amplex Red signal in mitochondria from denervated muscle between –CAT/–EBS and +EBS (*, p < 0.0001) and between –CAT/–EBS and +CAT (**, p < 0.05) by Student's t test. (control, white bars; denervated, black bars). B, denervation induces release of hydroperoxides from muscle mitochondria. Mitochondria were isolated from control and denervated muscles, and release of hydroperoxides was measured with xylenol-orange dye under acidic conditions in the presence/absence of catalase. The values are the means ± S.E. for three experiments. Statistical significance was based on the difference in absorbance in mitochondria from control and denervated muscle (with or without catalase) (*, p < 0.05) by one-way ANOVA with Newman Keul's multiple comparison test (–catalase, white bars; +catalase, black bars).
FIGURE 5.
FIGURE 5.
A, cPLA2 inhibitor inhibits the Amplex Red signal in mitochondria from denervated muscle. The Amplex Red assay was performed in the absence/presence of the cPLA2 inhibitor, AACOCF3 (20 μm) with substrates (glutamate/malate (G/M), 5 mm; succinate (S), 10 mm) and inhibitors (rotenone (R), antimycin A (AA), 0.5 μm). AACOCF3 inhibited the Amplex Red signal in mitochondria from denervated muscle to control values in the absence (State 1) and in the presence of respiratory substrates (glutamate/malate and succinate/rotenone). The values are the means ± S.E. for six or seven experiments. Statistical significance was based on the difference in Amplex Red signal in the absence (–) and presence (+) of AACOCF3 within each experimental condition (*, p < 0.001; **, p < 0.01) by one-way ANOVA with Newman Keul's multiple comparison test. (control, white bars; denervated (–AACOCF3), black bars; denervated (+AACOCF3), gray bars). B, cPLA2 inhibitor inhibits the Amplex Red signal in mitochondria from Sod1–/– mice. The Amplex Red assay was performed in the presence/absence of AACOCF3 (20μm) in 12-month-old Sod1–/– mice. AACOCF3 inhibited the Amplex Red signal (State 1) to control values. The values are the means ± S.E. for three or four experiments. Statistical significance was based on the difference in Amplex Red signal in the absence (–) and presence (+) of AACOCF3 in Sod1–/– (*, p < 0.001) by one-way ANOVA with Newman Keul's multiple comparison test (wild type, white bars; Sod1–/–, black bars).
FIGURE 6.
FIGURE 6.
cPLA2 protein expression is elevated in denervated muscle. Control and denervated muscles were homogenized in radioimmune precipitation assay buffer with Triton X-100 and 1× protease inhibitor. Equivalent amounts of protein (120 μg) were resolved by gel electrophoresis and transferred to polyvinylidene difluoride membrane, and cPLA2 was identified by using mouse monoclonal antibody with actin as a loading control. *, p < 0.001 versus control by unpaired t test.
FIGURE 7.
FIGURE 7.
Inhibition of muscle atrophy and decrease in Amplex Red signal in CR mice in response to denervation. The mice were sacrificed, the tissues were collected, and Amplex Red signal was measured 7 days after surgery in mitochondria from control and denervated muscle from AL and CR mice (State 1). A, loss of gastrocnemius muscle mass/100g body weight in AL and CR mice in response to denervation. B, denervated/control muscle ratio in AL and CR mice (*, p < 0.000001) by Student's t test. C, Amplex Red signal in muscle mitochondria from AL and CR mice in response to denervation surgery. Statistical significance was based on the difference in Amplex Red signal in mitochondria from AL and CR denervated muscle (*, p < 0.05) by one-way ANOVA with Newman Keul's multiple comparison test. The values are expressed as the means ± S.E. of n = 15–16 mice (muscle mass) and n = 8 (ROS). A and C, control, white bars; denervated, black bars. B, AL, white bar; CR, black bar.
FIGURE 8.
FIGURE 8.
Inhibition of muscle atrophy and decrease in Amplex Red signal in Gpx4-Tg mice in response to denervation. Denervation was induced by surgical transection of the sciatic nerve at the level of femur. The contralateral limb served as a control. The mice were sacrificed, tissues were collected, and Amplex Red signal was measured 7 days after surgery in mitochondria isolated from control and denervated muscle from WT and Gpx4-Tg mice (State 1). A, loss of gastrocnemius muscle mass/100 g of body weight in WT and Gpx4Tg mice in response to denervation. B, denervated/control muscle ratio in WT and Gpx4-Tg mice (*, p = 0.0001) by Student's t test. C, Amplex Red signal in mitochondria from WT and Gpx4-Tg mice in response to denervation surgery. Statistical significance was based on the difference in Amplex Red signal in mitochondria from WT and Gpx4-Tg denervated muscle (*, p < 0.05) by one-way ANOVA with Newman Keul's multiple comparison test. The values are expressed as the means ± S.E. of n = 8 mice. A and C, control, white bars; denervated, black bars. B, WT, white bar; Gpx4-Tg, black bar.
FIGURE 9.
FIGURE 9.
Muscle mitochondria release fatty acid hydroperoxides in response to denervation. Denervation induced by sciatic nerve transection is associated with dramatic release of fatty acid hydroperoxides from skeletal muscle mitochondria. We propose cPLA2 as a source for these hydroperoxides because cPLA2 expression is increased in denervated muscle and the cPLA2 inhibitor; AACOCF3 inhibits the Amplex Red signal in mitochondria from denervated muscle. Gpx4 reduces fatty acid hydroperoxides to hydroxides, thereby decreasing the Amplex Red signal in Gpx4-Tg mice.

Similar articles

Cited by

References

    1. Karakelides, H., and Nair, K. S. (2005) Curr. Top Dev. Biol. 68 123–148 - PubMed
    1. Greenlund, L. J., and Nair, K. S. (2003) Mech. Ageing Dev. 124 287–299 - PubMed
    1. Doherty, T. J., Vandervoort, A. A., Taylor, A. W., and Brown, W. F. (1993) J. Appl. Physiol. 74 868–874 - PubMed
    1. Thomason, D. B., and Booth, F. W. (1990) J. Appl. Physiol. 68 1–12 - PubMed
    1. Delbono, O. (2003) Aging Cell 2 21–29 - PubMed

Publication types

MeSH terms

Substances

LinkOut - more resources