Comparative Study
. 2009 Feb;16(1):45-58.
doi: 10.1093/dnares/dsn030. Epub 2008 Nov 11.

Database for mRNA half-life of 19 977 genes obtained by DNA microarray analysis of pluripotent and differentiating mouse embryonic stem cells

Affiliations
Comparative Study

Database for mRNA half-life of 19 977 genes obtained by DNA microarray analysis of pluripotent and differentiating mouse embryonic stem cells

Lioudmila V Sharova et al. DNA Res. 2009 Feb.

Abstract

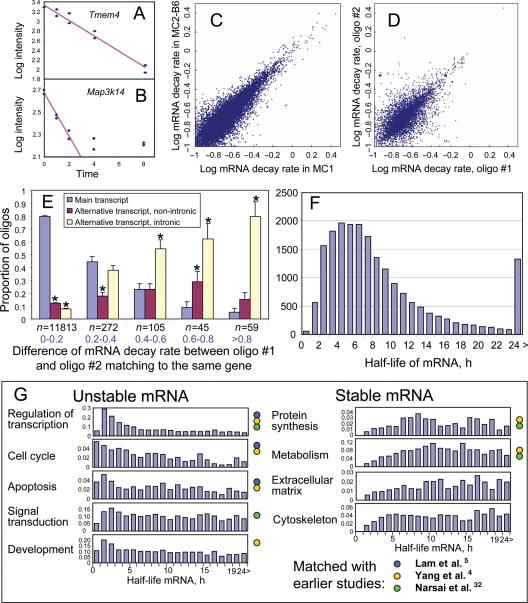
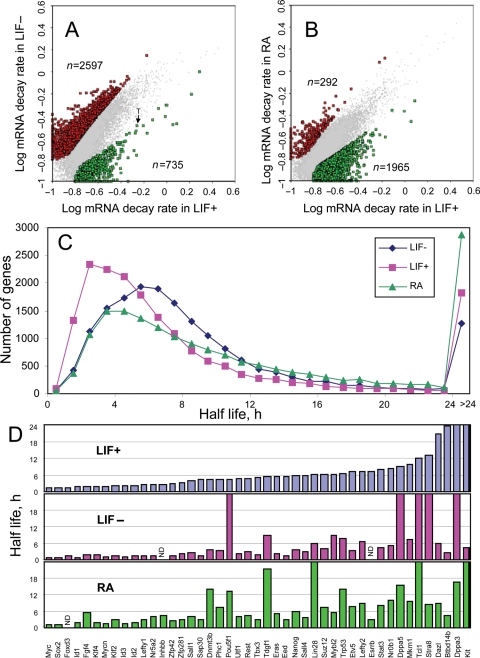
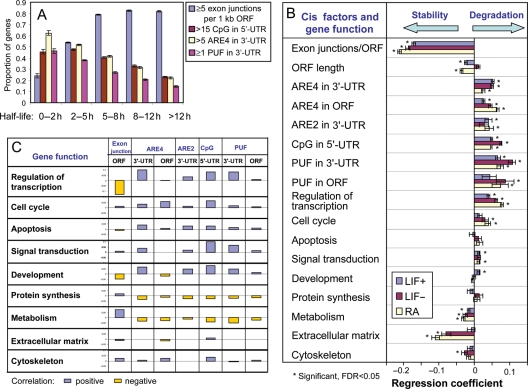
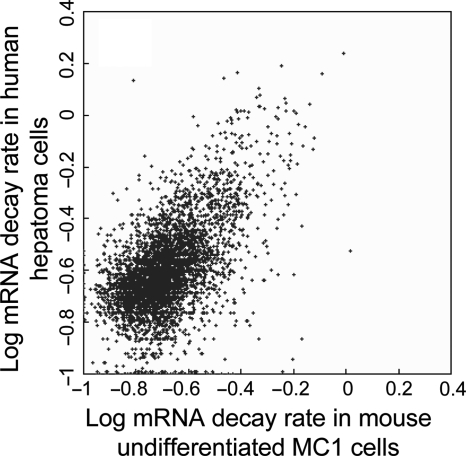
Degradation of mRNA is one of the key processes that control the steady-state level of gene expression. However, the rate of mRNA decay for the majority of genes is not known. We successfully obtained the rate of mRNA decay for 19 977 non-redundant genes by microarray analysis of RNA samples obtained from mouse embryonic stem (ES) cells. Median estimated half-life was 7.1 h and only <100 genes, including Prdm1, Myc, Gadd45 g, Foxa2, Hes5 and Trib1, showed half-life less than 1 h. In general, mRNA species with short half-life were enriched among genes with regulatory functions (transcription factors), whereas mRNA species with long half-life were enriched among genes related to metabolism and structure (extracellular matrix, cytoskeleton). The stability of mRNAs correlated more significantly with the structural features of genes than the function of genes: mRNA stability showed the most significant positive correlation with the number of exon junctions per open reading frame length, and negative correlation with the presence of PUF-binding motifs and AU-rich elements in 3'-untranslated region (UTR) and CpG di-nucleotides in the 5'-UTR. The mRNA decay rates presented in this report are the largest data set for mammals and the first for ES cells.


Figures

Figure 1
Figure 1
Stability of mRNA in mouse ES cells. (A and B) Regression of gene expression level (microarray signal intensity in log scale) versus time after suppressing transcription by actinomycin D (y = a + bx) is used to estimate the rate of mRNA decay, d = b*ln(10). All 10 data points are used for an example (A) and only six data points are used for and example (B). (C) Comparison between mRNA decay rates estimated for MC1 ES cells and those estimated for MC2-B6 ES cells. Rates are log-transformed, log10(d + 0.1). (D) Comparison between mRNA decay rates estimated using different probes (#1 and #2) on the microarray, which match to the main transcript of the same gene. Only the data for MC1 cells are shown. (E) Comparison of mRNA decay rates identified with the best probe (#1) from the main transcript of each gene with decay rates estimated using other probe (#2) that matched the same gene; pairs of probes were first classified into groups according to the difference in estimated mRNA decay rate (group size is shown below bars, n), and then the proportion of probes #2 that matched different types of transcripts and/or introns was estimated and plotted for each group. (F) Frequency distribution of mRNA half-life among all genes. (G) Frequency distribution of mRNA half-life in different functional categories of genes; color circles indicate that the functional group was previously identified as being over-represented among stable or unstable mRNA species.
Figure 2
Figure 2
Change in mRNA decay rates in ES cells after differentiation. (A) Change of mRNA decay rates after 7 days of differentiation in LIF− conditions; significant changes (FDR <0.05 and >2-fold change of half-life) is shown by red and green dots; rates are log-transformed, log10(d + 0.1). (B) Change in mRNA decay rates after 7 days of differentiation in RA conditions. (C) Frequency distribution of mRNA half-life in undifferentiated MC1 cells (LIF+) compared with cells differentiated after LIF withdrawal (LIF−) and retinoic acid (RA) treatment. (D) Half-life of mRNA of genes associated with pluripotent state of ES cells in undifferentiated cells (LIF+) and upon differentiation (LIF− and RA).
Figure 3
Figure 3
Effect of structural and functional characteristics of genes on the rate of mRNA decay. (A) Proportion of genes with increased number of exon junctions, CpG di-nucleotides in 5′-UTR, and ARE4 and PUF motifs in 3′-UTR in groups of genes with different range of mRNA half-life. (B) Regression coefficients for the effect of structural elements (cis-factors) and gene function on the mRNA decay rate; abundance of structural elements and mRNA decay rates are log-transformed. (C) Correlation between functional characteristics of genes and abundance of structural elements (log-transformed).
Figure 4
Figure 4
Comparison of mRNA decay rates for orthologous genes in mouse ES cells and in human hepatocytes (from the reference) Rates are log-transformed, log10(d + 0.1). Human mRNA decay rates were re-normalized using average decay rate of 200 most unstable mRNA species for proper comparison.

References

    1. Raghavan A., Bohjanen P. R. Microarray-based analyses of mRNA decay in the regulation of mammalian gene expression. Brief Funct. Genomic Proteomic. 2004;3:112–124. - PubMed
    1. Bolognani F., Perrone-Bizzozero N. I. RNA–protein interactions and control of mRNA stability in neurons. J. Neurosci. Res. 2008;86:481–489. - PubMed
    1. Raghavan A., Ogilvie R. L., Reilly C., et al. Genome-wide analysis of mRNA decay in resting and activated primary human T lymphocytes. Nucleic Acids Res. 2002;30:5529–5538. - PMC - PubMed
    1. Yang E., van Nimwegen E., Zavolan M., et al. Decay rates of human mRNAs: correlation with functional characteristics and sequence attributes. Genome Res. 2003;13:1863–1872. - PMC - PubMed
    1. Lam L. T., Pickeral O. K., Peng A. C., et al. Genomic-scale measurement of mRNA turnover and the mechanisms of action of the anti-cancer drug flavopiridol. Genome Biol. 2001;2:research0041.1–research0041.11. - PMC - PubMed

Publication types