

Early exercise regimen improves insulin sensitivity in the intrauterine growth-restricted adult female rat offspring
- PMID: 19001551
- PMCID: PMC2645014
- DOI: 10.1152/ajpendo.90473.2008
Early exercise regimen improves insulin sensitivity in the intrauterine growth-restricted adult female rat offspring
Abstract
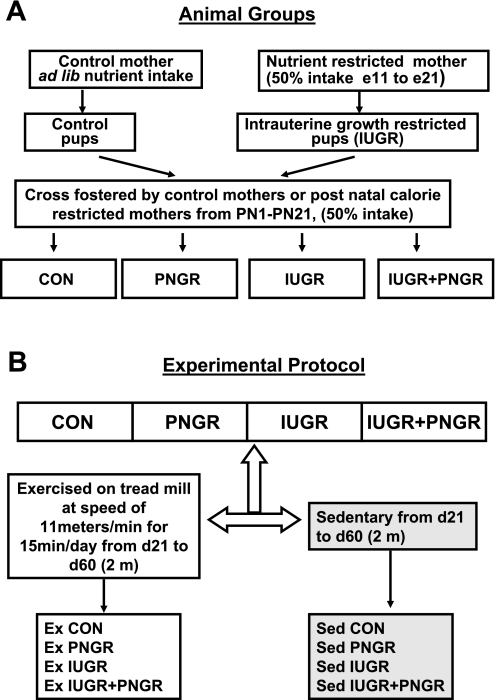
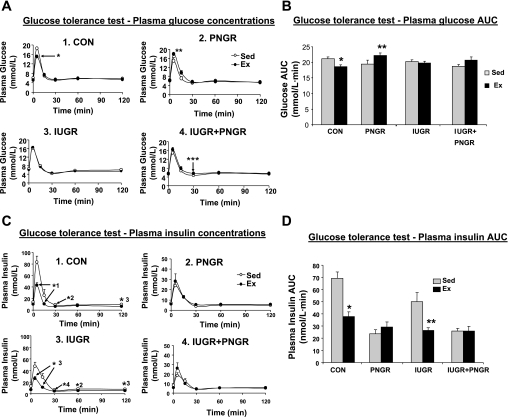
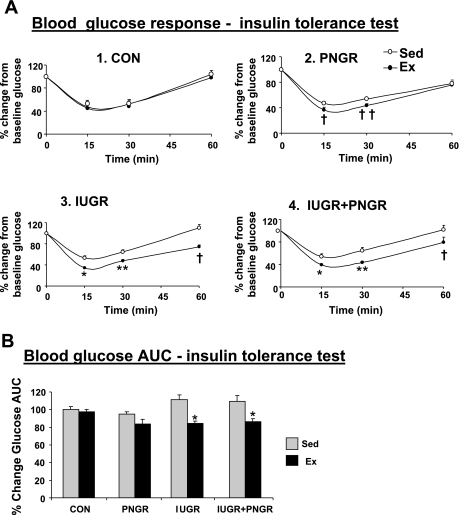
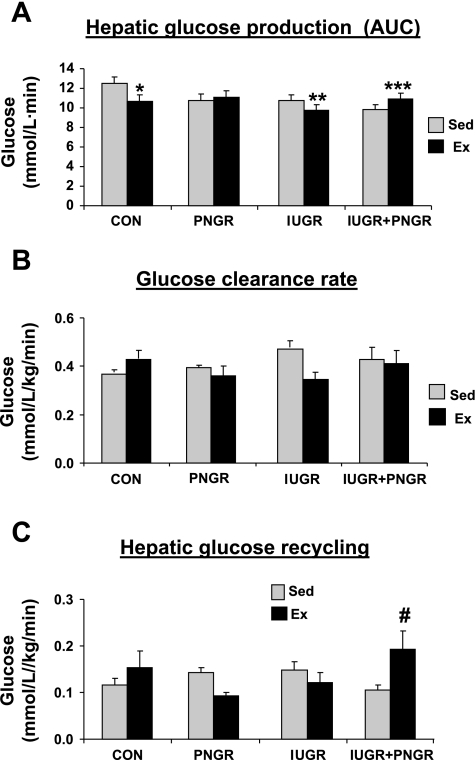
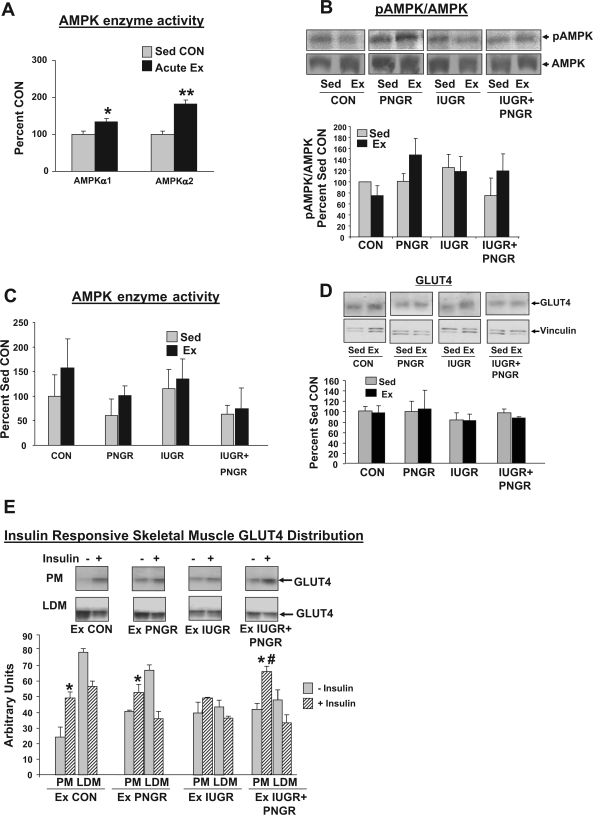
We examined the effect of early exercise training (Ex) on glucose kinetics, basal, and insulin-stimulated skeletal muscle (SKM) plasma membrane (PM) GLUT4 in pre- and/or postnatal nutrient-restricted adult rat offspring compared with sedentary (Sed) state. Pregestational control female (Ex CON vs. Sed CON) and offspring exposed to prenatal (Ex IUGR vs. Sed IUGR), postnatal (Ex PNGR vs. Sed PNGR), or pre- and postnatal (Ex IUGR + PNGR vs. Sed IUGR + PNGR) nutrient restriction were studied. The combined effect of exercise and pre/postnatal nutrition in the Ex IUGR demonstrated positive effects on basal and glucose-stimulated plasma insulin response (GSIR) with suppression of endogenous hepatic glucose production (HGP) compared with sedentary state. Ex PNGR was hyperglycemic after glucose challenge with no change in glucose-stimulated insulin production or HGP compared with sedentary state. Ex IUGR + PNGR remained glucose tolerant with unchanged glucose-stimulated insulin production but increased endogenous HGP compared with sedentary state. Basal SKM PM-associated GLUT4 was unchanged by exercise in all four groups. Whereas Ex PNGR and Ex IUGR + PNGR insulin responsiveness was similar to that of Ex CON, Ex IUGR remained nonresponsive to insulin. Early introduction of regular Ex in the pregestational female offspring had a positive effect on hepatic adaptation to GSIR and HGP in IUGR and IUGR + PNGR, with no effect in PNGR. Change in insulin responsiveness of SKM GLUT4 translocation was observed in exercised IUGR + PNGR and PNGR but not in exercised IUGR.
Figures
Similar articles
-
Early exposure of the pregestational intrauterine and postnatal growth-restricted female offspring to a peroxisome proliferator-activated receptor-{gamma} agonist.Am J Physiol Endocrinol Metab. 2010 Mar;298(3):E489-98. doi: 10.1152/ajpendo.00361.2009. Epub 2009 Dec 15. Am J Physiol Endocrinol Metab. 2010. PMID: 20009032 Free PMC article.
-
Peroxisome proliferator-activated receptor-gamma agonist improves skeletal muscle insulin signaling in the pregestational intrauterine growth-restricted rat offspring.Am J Physiol Endocrinol Metab. 2009 Aug;297(2):E514-24. doi: 10.1152/ajpendo.00008.2009. Epub 2009 Jun 2. Am J Physiol Endocrinol Metab. 2009. PMID: 19491300 Free PMC article.
-
Myocardial macronutrient transporter adaptations in the adult pregestational female intrauterine and postnatal growth-restricted offspring.Am J Physiol Endocrinol Metab. 2012 Jun 1;302(11):E1352-62. doi: 10.1152/ajpendo.00539.2011. Epub 2012 Feb 14. Am J Physiol Endocrinol Metab. 2012. PMID: 22338075 Free PMC article.
-
Exercise as an intervention to improve metabolic outcomes after intrauterine growth restriction.Am J Physiol Endocrinol Metab. 2014 May 1;306(9):E999-1012. doi: 10.1152/ajpendo.00456.2013. Epub 2014 Mar 11. Am J Physiol Endocrinol Metab. 2014. PMID: 24619880 Review.
-
Developmental programming in response to intrauterine growth restriction impairs myoblast function and skeletal muscle metabolism.J Pregnancy. 2012;2012:631038. doi: 10.1155/2012/631038. Epub 2012 Jul 31. J Pregnancy. 2012. PMID: 22900186 Free PMC article. Review.
Cited by
-
Fetal origins of adult disease.Curr Probl Pediatr Adolesc Health Care. 2011 Jul;41(6):158-76. doi: 10.1016/j.cppeds.2011.01.001. Curr Probl Pediatr Adolesc Health Care. 2011. PMID: 21684471 Free PMC article. Review.
-
Embryo-transfer of the F2 postnatal calorie restricted female rat offspring into a control intra-uterine environment normalizes the metabolic phenotype.Metabolism. 2013 Mar;62(3):432-41. doi: 10.1016/j.metabol.2012.08.026. Epub 2012 Sep 27. Metabolism. 2013. PMID: 23021963 Free PMC article.
-
Maternal exercise improves insulin sensitivity in mature rat offspring.Med Sci Sports Exerc. 2013 May;45(5):832-40. doi: 10.1249/MSS.0b013e31827de953. Med Sci Sports Exerc. 2013. PMID: 23247711 Free PMC article.
-
Intrauterine Growth Restriction: Hungry for an Answer.Physiology (Bethesda). 2016 Mar;31(2):131-46. doi: 10.1152/physiol.00033.2015. Physiology (Bethesda). 2016. PMID: 26889018 Free PMC article. Review.
-
Vascular effects of aerobic exercise training in rat adult offspring exposed to hypoxia-induced intrauterine growth restriction.J Physiol. 2015 Apr 15;593(8):1913-29. doi: 10.1113/jphysiol.2014.288449. Epub 2015 Feb 19. J Physiol. 2015. PMID: 25616117 Free PMC article.
References
-
- Barker DJ The malnourished baby and infant. Br Med Bull 60: 69–88, 2001. - PubMed
-
- Barker DJ Adult consequences of fetal growth restriction. Clin Obstet Gynecol 49: 270–283, 2006. - PubMed
-
- Barker DJ, Hales CN, Fall CH, Osmond C, Phipps K, Clark PM. Type 2 (non-insulin-dependent) diabetes mellitus, hypertension and hyperlipidaemia (syndrome X) relation to reduced fetal growth. Diabetologia 36: 62–67, 1993. - PubMed
-
- Bazaes RA, Mericq V. Premature birth and insulin resistance. N Engl J Med 352: 939–940, 2005. - PubMed
-
- Bernard JR, Crain AM, Rivas DA, Herr HJ, Reeder DW, Yaspelkis BB 3rd. Chronic aerobic exercise enhances components of the classical and novel insulin signaling cascades in Sprague-Dawley rat skeletal muscle. Acta Physiol Scand 183: 357–366, 2005. - PubMed
Publication types
MeSH terms
Substances
Grants and funding
LinkOut - more resources
Full Text Sources