. 2008 Nov 19;100(22):1592-605.
doi: 10.1093/jnci/djn379. Epub 2008 Nov 11.

Overexpression of OLC1, cigarette smoke, and human lung tumorigenesis

Affiliations

Overexpression of OLC1, cigarette smoke, and human lung tumorigenesis

Jingsong Yuan et al. J Natl Cancer Inst. .

Abstract

Background: Exposure to cigarette smoke is a major risk factor for lung cancer, but how it induces cancer is unclear. The overexpressed in lung cancer 1 (OLC1) gene is one of 50 candidate lung cancer genes identified by suppression subtractive hybridization as having higher expression in squamous cell carcinoma (SCC) than normal lung epithelia.

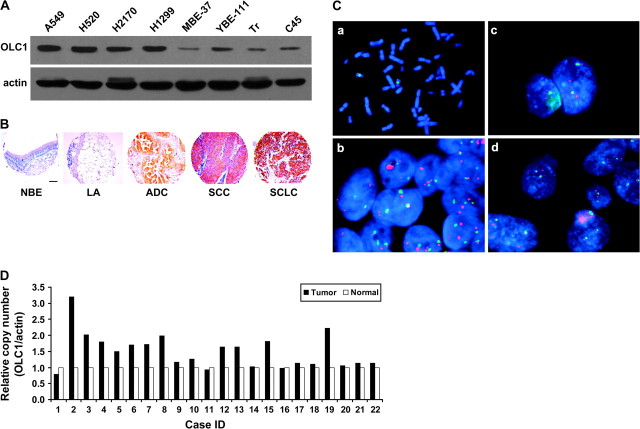
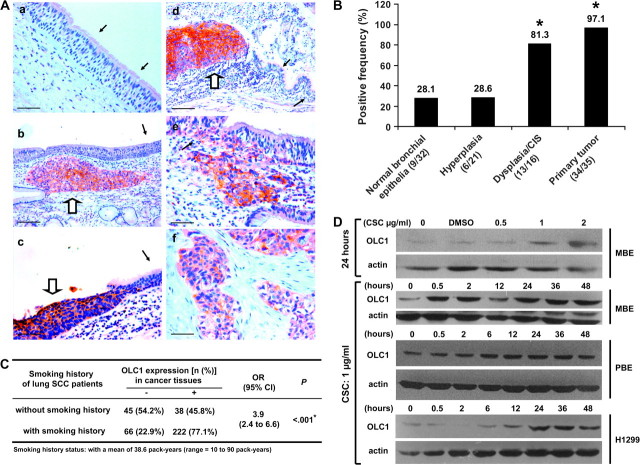
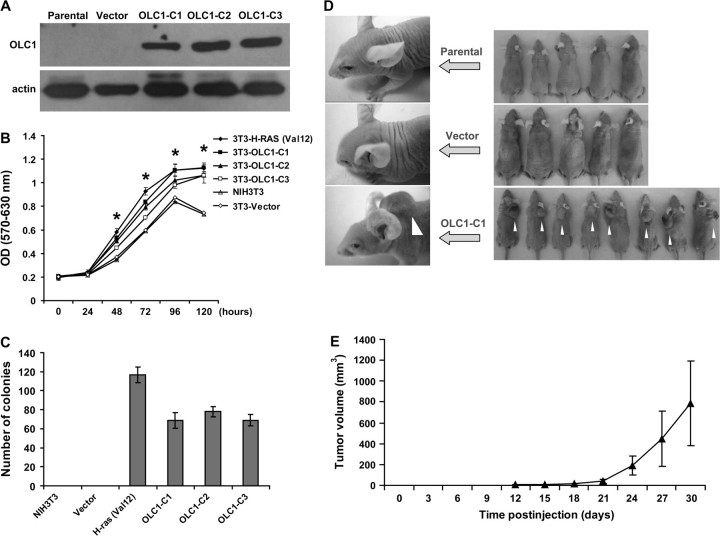
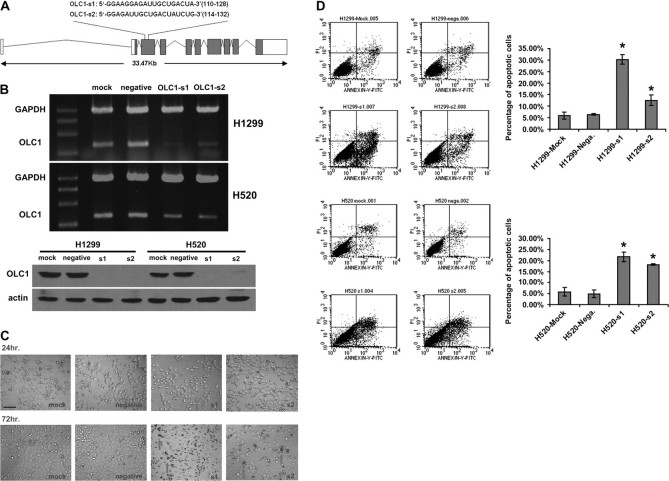
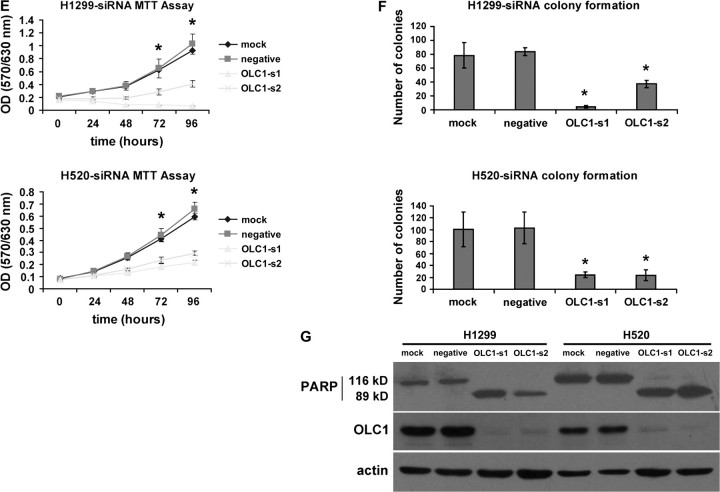
Methods: We used immunohistochemistry (IHC) to measure OLC1 protein levels in primary lung cancer samples from 559 patients and used fluorescence in situ hybridization to measure OLC1 copy number in primary SCC samples from 23 patients. We compared OLC1 protein expression in SCC samples of 371 patients with and without a smoking history using the Pearson chi(2) test. We assayed OLC1 protein levels by immunoblotting in H1299 human lung cancer cells, immortalized human bronchial epithelial cells, and primary cultured normal human bronchial epithelial cells that were treated with cigarette smoke condensate. We assayed tumor formation in athymic mice using NIH3T3 mouse fibroblast cells transfected with OLC1 (eight mice) and analyzed apoptosis and colony formation of H1299 and H520 lung cancer cells transfected with scrambled (negative) or OLC1 small interfering RNAs (siRNAs) (s1).

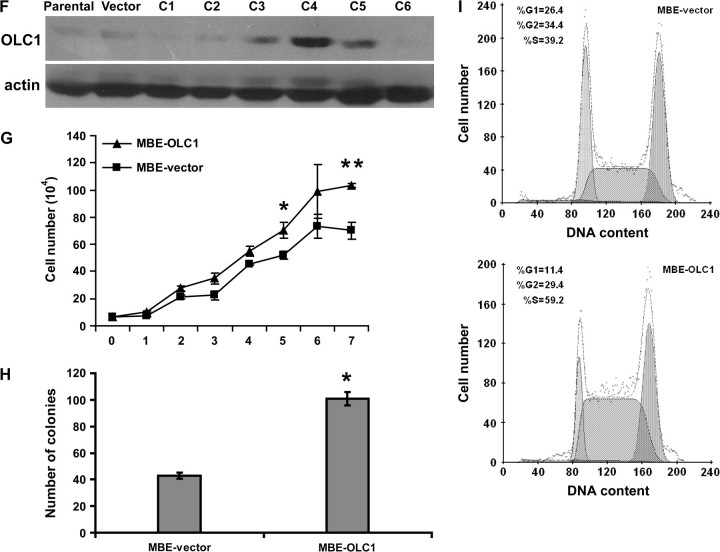
Results: OLC1 protein was overexpressed in 387 of 464 (83.4%) of primary lung cancers, as detected by IHC, and OLC1 was amplified in 14 of 23 (60%) of SCC samples. OLC1 protein overexpression was more common in SCC patients with a smoking history than those without (77.1% vs 45.8%, P < .001). In addition, cigarette smoke condensate increased OLC1 protein levels in H1299 cells, immortalized human bronchial epithelial cells, and primary cultured normal human bronchial epithelial cells. Overexpression of OLC1 induced tumor formation in athymic mice (control vs OLC1, 0% vs 100%). Knockdown of OLC1 increased apoptosis (mean percentage of apoptotic H1299 cells, s1 vs negative: 30.3% vs 6.4%, difference = 23.9%, 95% confidence interval [CI] = 19.1% to 28.5%, P = .002; mean percentage of apoptotic H520 cells, s1 vs negative: 21.6% vs 4.9%, difference = 16.7%, 95% CI = 10.6% to 22.8%, P = .007) and decreased colony formation (mean no. of colonies of H1299 cells transfected with siRNAs, negative vs s1: 84 vs 4, difference = 80, 95% CI = 71 to 88, P < .001; mean no. of colonies of H520 cells transfected with siRNAs, negative vs s1: 103 vs 24, difference = 79, 95% CI = 40 to 116, P = .005).

Conclusions: OLC1 is a candidate oncogene in lung cancer whose expression may be regulated by exposure to cigarette smoke.


Figures

Figure 1
Figure 1
Identification of overexpressed in lung cancer 1 (OLC1) from suppression subtractive hybridization (SSH) libraries through phenotype-based screening. A) Phenotype-based screening in NIH3T3 mouse fibroblast cells. The foci formation assay was performed with Geneticin selection for 3 weeks after transfection. Foci formation in rlcrt-000196–transfected cells is indicated with an arrow. Scale bar = 100 μm. B) Genomic alignment of two independent expressed sequence tag (EST) clones to OLC1 in the SSH library. C) Comparison of OLC1 amino acid sequences from different species. Black and gray shading indicates identical and conserved residues, respectively. D) Phylogenetic trees for OLC1. The protein sequences were obtained by conceptual translation of GenBank DNA entries from each species corresponding to the following accession numbers. Homo sapiens: P53990; Mus musculus: NP_082294; Rattus norvegicus: XP_226448; Anopheles gambiae: XP_315909; Drosophila melanogaster: NP_648058; Caenorhabditis elegans: NP_506170; Tetraodon nigroviridis: CAF92099; Danio rerio: NP_997750; Saccharomyces cerevisiae: P53843; Schizosaccharomyces pombe: NP_588331; Magnaporthe grisea: XP_363839; Neurospora crassa: XP_328697. The alignment was generated by using ClustalX version 1.83 (41), and phylogenetic tree analysis was performed by TreeView X version 0.4 which can be accessed from http://darwin.zoology.gla.ac.uk/∼rpage/treeviewx/.
Figure 2
Figure 2
Overexpression and amplification of overexpressed in lung cancer 1 (OLC1) in lung cancer tissues and cell lines. A) Immunoblot of OLC1 in lung cancer cell lines (A549, H520, H2170, and H1299) and immortalized bronchial epithelial cell lines (MBE, YBE, Tr, and C45) using a rabbit polyclonal anti-OLC1 antibody. Blots were probed with mouse monoclonal anti–β-actin antibody as a control for loading and transfer. A representative blot from three independent experiments is shown. B) Representative examples of tissue microarray–based immunohistochemical staining of OLC1 in human lung cancer and normal lung tissues using a rabbit polyclonal anti-OLC1 antibody in (A). Scale bar = 100 μm. Lung adenocarcinoma (ADC), squamous cell carcinoma (SCC), and small-cell lung cancer (SCLC) showed positive staining, but samples of normal bronchial epithelia (NBE) and lung alveolus (LA) appeared negative. C) Amplification of OLC1 detected by fluorescence in situ hybridization. a, metaphase spread showing that the OLC1 bacterial artificial chromosome (BAC) maps to 16q22; b, the H2170 cell line has 4-6 OLC1–hybridizing loci (red); c, this lung SCC has five copies of OLC1; d, this lung SCC has two copies each of OLC1 and chromosome 16 centromere (green). D) Pairwise comparison of OLC1 genomic copy numbers in lung SCC and matched normal lung tissues from 22 patients. Results are shown as relative copy number (OLC1/Actin) from three replicates. β-actin was used as the input reference.
Figure 3
Figure 3
The association of overexpressed in lung cancer 1 (OLC1) overexpression with cigarette smoking and lung tumorigenesis. A) Representative examples of immunohistochemical (IHC) staining of OLC1 in lung squamous cell carcinoma (SCC) tissue samples from 35 lung SCC patients with various preneoplastic or neoplastic lesions using a rabbit polyclonal anti-OLC1 antibody. a, normal bronchial epithelia indicated by black arrows, negative; b, hyperplasia (black arrow, negative) and a primary SCC (open arrow, positive); c, severe dysplasia (open arrow, positive) and the nearby normal bronchial epithelia (black arrow, negative); d, carcinoma in situ (CIS, open arrow, positive) and the nearby normal bronchial epithelia (black arrows, negative); e, SCC nest, scattered cancer cells in the basal layer (open arrow, positive), and the adjacent normal epithelia (black arrow, negative); f, primary SCC of the lung, positive. Scale bars in a, c, e, and f represent 50 μm and those in b and d represent 100 μm. B) Results of IHC staining for OLC1, performed as described in (A), in lung SCC tissue samples from 35 lung SCC patients with various preneoplastic or neoplastic lesions. *Primary tumor vs normal bronchial epithelia: P < .001; primary tumor vs hyperplasia: P < .001; dysplasia/CIS vs hyperplasia: P < .001; dysplasia/CIS vs normal bronchial epithelia: P < .001. All P values were two-sided and calculated using generalized estimating equation (GEE) analysis, with 1 degree of freedom. C) OLC1 protein overexpression as detected by IHC in the paraffin-embedded tissue samples of primary lung SCCs from 371 patients and smoking history in these lung SCC patients. *P < .001 (two-sided), calculated using the Pearson chi-square test with 1 degree of freedom. D) Cigarette smoke condensate (CSC) treatment and OLC1 overexpression in MBE, H1299, and primary cultured normal human bronchial epithelial (PBE) cells. Immunoblot analysis of OLC1 expression using the OLC1 antibody in (A). A total of 60 μg of total protein was loaded from MBE and PBE cells, and 10 μg of total protein was loaded from H1299 cells. Blots were probed with mouse monoclonal anti–β-actin antibody as a control for protein loading and transfer. One representative blot from three independent experiments is shown.
Figure 4
Figure 4
Effect of overexpressed in lung cancer 1 (OLC1) overexpression on NIH3T3 and MBE cells. A) Immunoblot of untransfected NIH3T3 cells (Parental), NIH3T3 cells transfected with empty vector (Vector), and NIH3T3 clones (OLC1-C1 through C3) transfected with OLC1 DNA, using a rabbit polyclonal anti-OLC1 antibody. Blots were probed with monoclonal mouse anti–β-actin antibody to control for protein loading and transfer. One representative of three independent experiments is shown. B) The tetrazolium salt 3-(4,5-dimethylthiazol-2-yl)-2,5-diphenyltetrazolium bromide proliferation assay of NIH3T3 cell clones in (A). H-RasVal12–transformed NIH3T3 cells were used as a positive control. Means and 95% confidence intervals (CIs, error bars) are shown. Error bars represent 95% CIs for three independent experiments performed in triplicate. *OLC1-C1, C2, C3, or H-RasVal12–transformed NIH3T3 cells vs Vector, P < .001. C) Numbers of colonies in the soft agar assay from the three OLC1 NIH3T3 cell clones (C1–C3), the NIH3T3 parental line, and vector control cells. Colonies larger than 200 μm in diameter were counted. Means and 95% CIs (error bars) are shown from three independent experiments performed in triplicate. D, E) Tumors observed in nude mice inoculated NIH3T3 parental, vector, or OLC1-C1 (white arrows) cells. Tumor size was measured every 3 days; the error bars in (E) represent 95% CIs of the mean volume of eight tumors induced by OLC1-C1. F) Immunoblot analysis of OLC1 protein expression in MBE cell clones stably overexpressing OLC1 using the antibody in (A). Clone 4 (C4, also MBE-OLC1) was used in subsequent experiments because it had the highest level of OLC1 expression. G) In vitro growth of MBE-OLC1 and MBE-vector cells. Error bars represent 95% CIs from a representative experiment (counted from triplicate wells) of three independent ones. *MBE-OLC1 vs MBE-vector cells, P = .005; **P < .001. H) Colony formation assay of MBE-OLC1 and MBE-vector cells. Means and 95% CIs (error bars) are shown from three independent experiments performed in triplicate. *MBE-OLC1 vs MBE-vector cells, P < .001. I) Cell cycle analysis of MBE-OLC1 and MBE-vector cells. Cells (1 × 10⁶) were stained with propidium iodide, and their DNA content was determined using flow cytometry. One representative experiment of three independent experiments is shown.
Figure 4
Figure 4
Effect of overexpressed in lung cancer 1 (OLC1) overexpression on NIH3T3 and MBE cells. A) Immunoblot of untransfected NIH3T3 cells (Parental), NIH3T3 cells transfected with empty vector (Vector), and NIH3T3 clones (OLC1-C1 through C3) transfected with OLC1 DNA, using a rabbit polyclonal anti-OLC1 antibody. Blots were probed with monoclonal mouse anti–β-actin antibody to control for protein loading and transfer. One representative of three independent experiments is shown. B) The tetrazolium salt 3-(4,5-dimethylthiazol-2-yl)-2,5-diphenyltetrazolium bromide proliferation assay of NIH3T3 cell clones in (A). H-RasVal12–transformed NIH3T3 cells were used as a positive control. Means and 95% confidence intervals (CIs, error bars) are shown. Error bars represent 95% CIs for three independent experiments performed in triplicate. *OLC1-C1, C2, C3, or H-RasVal12–transformed NIH3T3 cells vs Vector, P < .001. C) Numbers of colonies in the soft agar assay from the three OLC1 NIH3T3 cell clones (C1–C3), the NIH3T3 parental line, and vector control cells. Colonies larger than 200 μm in diameter were counted. Means and 95% CIs (error bars) are shown from three independent experiments performed in triplicate. D, E) Tumors observed in nude mice inoculated NIH3T3 parental, vector, or OLC1-C1 (white arrows) cells. Tumor size was measured every 3 days; the error bars in (E) represent 95% CIs of the mean volume of eight tumors induced by OLC1-C1. F) Immunoblot analysis of OLC1 protein expression in MBE cell clones stably overexpressing OLC1 using the antibody in (A). Clone 4 (C4, also MBE-OLC1) was used in subsequent experiments because it had the highest level of OLC1 expression. G) In vitro growth of MBE-OLC1 and MBE-vector cells. Error bars represent 95% CIs from a representative experiment (counted from triplicate wells) of three independent ones. *MBE-OLC1 vs MBE-vector cells, P = .005; **P < .001. H) Colony formation assay of MBE-OLC1 and MBE-vector cells. Means and 95% CIs (error bars) are shown from three independent experiments performed in triplicate. *MBE-OLC1 vs MBE-vector cells, P < .001. I) Cell cycle analysis of MBE-OLC1 and MBE-vector cells. Cells (1 × 10⁶) were stained with propidium iodide, and their DNA content was determined using flow cytometry. One representative experiment of three independent experiments is shown.
Figure 5
Figure 5
Effect of overexpressed in lung cancer 1 (OLC1) knockdown with small interfering RNAs (siRNAs) on lung cancer cell lines H1299 and H520. A) Schematic representation of two siRNAs (si1 and si2) against OLC1. The sense sequences are shown. B) OLC1 knockdown in H1299 and H520 cells. Top, reverse transcription polymerase chain reaction analysis performed at 48 h after siRNAs transfection. Bottom, OLC1 protein detected by immunoblotting using a polyclonal rabbit anti-OLC1 antibody 72 h after siRNAs transfection. Cells that were transfected with no siRNA (mock) or a scrambled siRNA (negative) were used as negative controls. C) Apoptosis in H1299 cells at 72 h after transfection with OLC1-s1 and -s2 by as observed by optical microscopy. Arrows indicate the shrinking apoptotic cells. Scale bar = 50 μm. D) Left, flow cytometric analysis of H1299 and H520 cells stained with annexin-V-fluoroisothiocyanate (FITC) and propidium iodide (PI). Cells were harvested 72 h after siRNA transfection. Right, the percentage of apoptotic cells represents the percentage of annexin-V–positive cells. Means from two independent experiments and 95% CIs (error bars) are shown. Error bars represent 95% CIs of the two experiments (*H1299 cells: s1 vs negative, P = .002; s1 vs mock, P = .003; s2 vs negative, P = .035; s2 vs mock, P = .042. H520 cells: s1 vs negative, P = .007; s1 vs mock, P = .009; s2 vs negative, P = .004; s2 vs mock, P = .006; Student two-sided t test). Similar results were obtained in two separate experiments. E) The tetrazolium salt 3-(4,5-dimethylthiazol-2-yl)-2,5-diphenyltetrazolium bromide proliferation assay of siRNA-transfected, mock, and negative H1299 and H520 cells. Error bars represent 95% CIs from one representative experiment with six replicates of three independent ones. *s1 or s2 vs negative, P < .001. F) Colony formation assay of siRNA-transfected, mock, and negative H1299 and H520 cells. Error bars represent 95% CIs from one representative experiment performed in triplicate of three independent ones (*H1299 cells: s1 vs negative control, P < .001; s1 vs mock control,P = .001; s2 vs negative control, P < .001; s2 vs mock control, P = .014. H520 cells: s1 vs negative control, P = .005; s1 vs mock control, P = .007; s2 vs negative control, P = .005; s2 vs mock control, P = .008; Student two-sided t test). G) Immunoblot analysis of PARP cleavage using a rabbit polyclonal anti-PARP antibody 72 h after transfection. Cells were transfected with OLC1 siRNAs (OLC1-s1 and -s2), with no siRNA (mock), or with a scrambled siRNA (negative). Blots were probed with polyclonal rabbit anti-OLC1 and with anti–β-actin as a control for protein loading and transfer. One representative of three independent experiments is shown.
Figure 5
Figure 5
Effect of overexpressed in lung cancer 1 (OLC1) knockdown with small interfering RNAs (siRNAs) on lung cancer cell lines H1299 and H520. A) Schematic representation of two siRNAs (si1 and si2) against OLC1. The sense sequences are shown. B) OLC1 knockdown in H1299 and H520 cells. Top, reverse transcription polymerase chain reaction analysis performed at 48 h after siRNAs transfection. Bottom, OLC1 protein detected by immunoblotting using a polyclonal rabbit anti-OLC1 antibody 72 h after siRNAs transfection. Cells that were transfected with no siRNA (mock) or a scrambled siRNA (negative) were used as negative controls. C) Apoptosis in H1299 cells at 72 h after transfection with OLC1-s1 and -s2 by as observed by optical microscopy. Arrows indicate the shrinking apoptotic cells. Scale bar = 50 μm. D) Left, flow cytometric analysis of H1299 and H520 cells stained with annexin-V-fluoroisothiocyanate (FITC) and propidium iodide (PI). Cells were harvested 72 h after siRNA transfection. Right, the percentage of apoptotic cells represents the percentage of annexin-V–positive cells. Means from two independent experiments and 95% CIs (error bars) are shown. Error bars represent 95% CIs of the two experiments (*H1299 cells: s1 vs negative, P = .002; s1 vs mock, P = .003; s2 vs negative, P = .035; s2 vs mock, P = .042. H520 cells: s1 vs negative, P = .007; s1 vs mock, P = .009; s2 vs negative, P = .004; s2 vs mock, P = .006; Student two-sided t test). Similar results were obtained in two separate experiments. E) The tetrazolium salt 3-(4,5-dimethylthiazol-2-yl)-2,5-diphenyltetrazolium bromide proliferation assay of siRNA-transfected, mock, and negative H1299 and H520 cells. Error bars represent 95% CIs from one representative experiment with six replicates of three independent ones. *s1 or s2 vs negative, P < .001. F) Colony formation assay of siRNA-transfected, mock, and negative H1299 and H520 cells. Error bars represent 95% CIs from one representative experiment performed in triplicate of three independent ones (*H1299 cells: s1 vs negative control, P < .001; s1 vs mock control,P = .001; s2 vs negative control, P < .001; s2 vs mock control, P = .014. H520 cells: s1 vs negative control, P = .005; s1 vs mock control, P = .007; s2 vs negative control, P = .005; s2 vs mock control, P = .008; Student two-sided t test). G) Immunoblot analysis of PARP cleavage using a rabbit polyclonal anti-PARP antibody 72 h after transfection. Cells were transfected with OLC1 siRNAs (OLC1-s1 and -s2), with no siRNA (mock), or with a scrambled siRNA (negative). Blots were probed with polyclonal rabbit anti-OLC1 and with anti–β-actin as a control for protein loading and transfer. One representative of three independent experiments is shown.

Comment in

  • Defining a candidate lung cancer gene.
    Kaye FJ. Kaye FJ. J Natl Cancer Inst. 2008 Nov 19;100(22):1564-5. doi: 10.1093/jnci/djn381. Epub 2008 Nov 11. J Natl Cancer Inst. 2008. PMID: 19001597 Free PMC article. No abstract available.

References

    1. Jemal A, Siegel R, Ward E, Murray T, Xu J, Thun MJ. Cancer statistics, 2007. CA Cancer J Clin. 2007;57(1):43–66. - PubMed
    1. Minna JD, Roth JA, Gazdar AF. Focus on lung cancer. Cancer Cell. 2002;1(1):49–52. - PubMed
    1. Hsu NY, Ho HC, Chow KC, et al. Overexpression of dihydrodiol dehydrogenase as a prognostic marker of non-small cell lung cancer. Cancer Res. 2001;61(6):2727–2731. - PubMed
    1. Hu Z, Lin D, Yuan J, et al. Overexpression of osteopontin is associated with more aggressive phenotypes in human non-small cell lung cancer. Clin Cancer Res. 2005;11(13):4646–4652. - PubMed
    1. Liao Z, Milas L. COX-2 and its inhibition as a molecular target in the prevention and treatment of lung cancer. Expert Rev Anticancer Ther. 2004;4(4):543–560. - PubMed

Publication types

MeSH terms

Associated data