. 2008 Nov 19;100(22):1606-29.
doi: 10.1093/jnci/djn365. Epub 2008 Nov 11.

Effect of disrupting seven-in-absentia homolog 2 function on lung cancer cell growth

Affiliations

Effect of disrupting seven-in-absentia homolog 2 function on lung cancer cell growth

Atique U Ahmed et al. J Natl Cancer Inst. .

Abstract

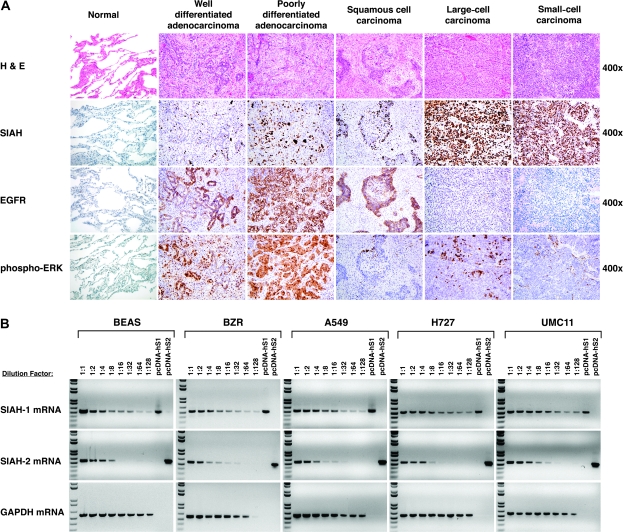
Background: Hyperactivated epidermal growth factor receptor (EGFR) and/or RAS signaling drives cellular transformation and tumorigenesis in human lung cancers, but agents that block activated EGFR and RAS signaling have not yet been demonstrated to substantially extend patients' lives. The human homolog of Drosophila seven-in-absentia--SIAH-1 and SIAH-2--are ubiquitin E3 ligases and conserved downstream components of the RAS pathway that are required for mammalian RAS signal transduction. We examined whether inhibiting SIAH-2 function blocks lung cancer growth.

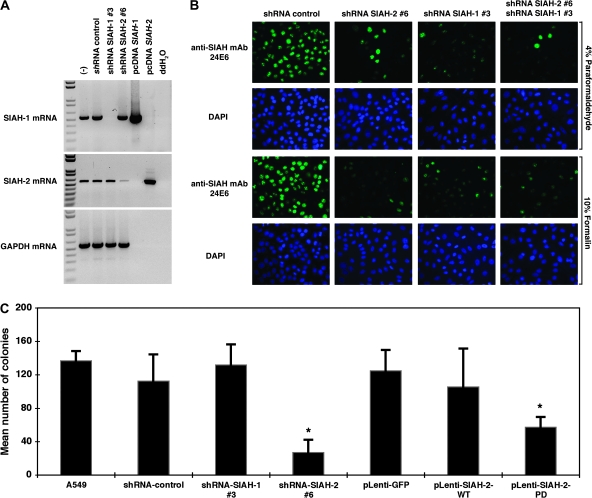
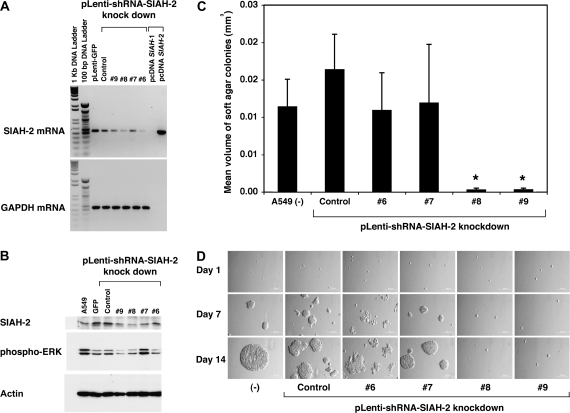
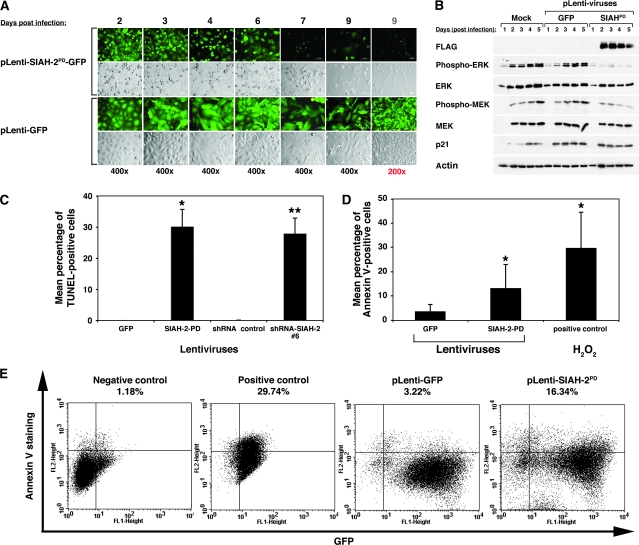
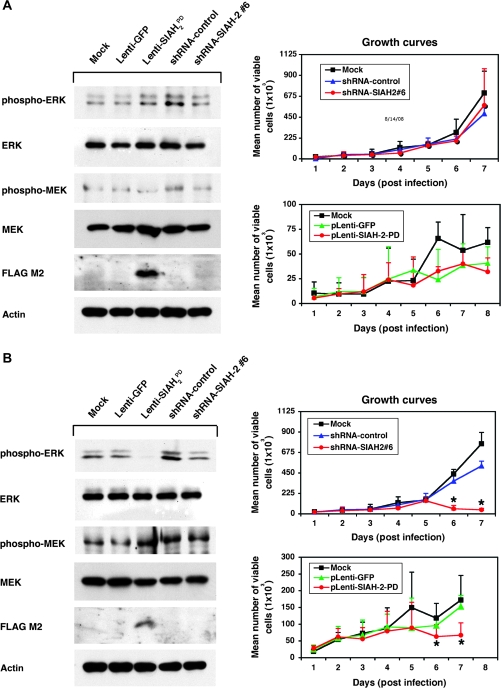
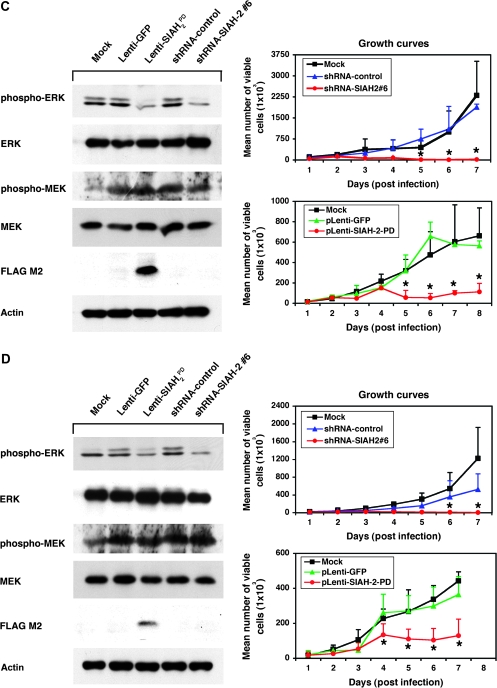
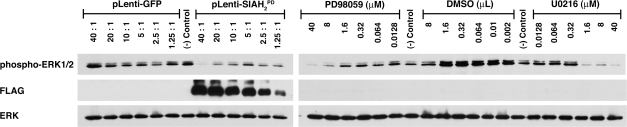
Methods: The antiproliferative and antitumorigenic effects of lentiviral expression of anti-SIAH-2 molecules (ie, a dominant-negative protease-deficient mutant of SIAH-2 [SIAH-2(PD)] and short hairpin RNA [shRNA]-mediated gene knockdown against SIAH-2) were assayed in normal human lung epithelial BEAS-2B cells and in human lung cancer BZR, A549, H727, and UMC11 cells by measuring cell proliferation rates, by assessing MAPK and other activated downstream components of the RAS pathway by immunoblotting, assessing apoptosis by terminal deoxynucleotidyltransferase-mediated UTP end-labeling (TUNEL) assay, quantifying anchorage-independent cell growth in soft agar, and assessing A549 cell-derived tumor growth in athymic nude mice (groups of 10 mice, with two injections of 1 x 10(6) cells each at the dorsal left and right scapular areas). All statistical tests were two-sided.

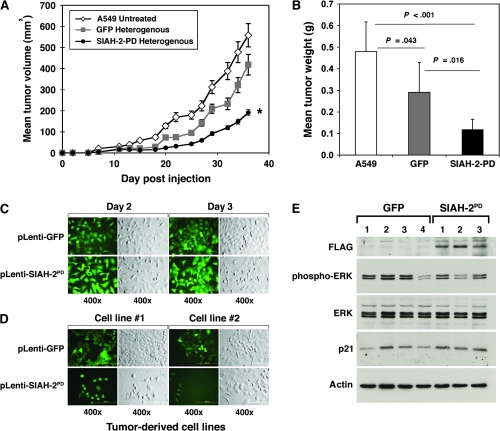
Results: SIAH-2 deficiency in human lung cancer cell lines reduced MAPK signaling and statistically significantly inhibited cell proliferation compared with those in SIAH-proficient cells (P < .001) and increased apoptosis (TUNEL-positive A549 cells 3 days after lentivirus infection: SIAH-2(PD) vs control, 30.1% vs 0.0%, difference = 30.1%, 95% confidence interval [CI] = 23.1% to 37.0%, P < .001; SIAH-2-shRNA#6 vs control shRNA, 27.9% vs 0.0%, difference = 27.9%, 95% CI = 23.1% to 32.6%, P < .001). SIAH-2 deficiency also reduced anchorage-independent growth of A549 cells in soft agar (mean number of colonies: SIAH-2(PD) vs control, 124.7 vs 57.3, difference = 67.3, 95% CI = 49.4 to 85.3, P < .001; shRNA-SIAH-2#6 vs shRNA control: 27.0 vs 119.7, difference = 92.7, 95% CI = 69.8 to 115.5, P < .001), and blocked the growth of A549 cell-derived tumors in nude mice (mean tumor volume on day 36 after A549 cell injection: SIAH-2(PD) infected vs uninfected, 191.0 vs 558.5 mm(3), difference = 367.5 mm(3), 95% CI = 237.6 to 497.4 mm(3), P < .001; SIAH-2(PD) infected vs control infected, 191.0 vs 418.3 mm(3), difference = 227.5 mm(3), 95% CI = 87.4 to 367.1 mm(3), P = .003; mean resected tumor weight: SIAH-2(PD) infected vs uninfected, 0.12 vs 0.48 g, difference = 0.36 g, 95% CI = 0.23 to 0.50 g, P < .001; SIAH-2(PD) infected vs control infected, 0.12 vs 0.29 g, difference = 0.17 g, 95% CI = 0.04 to 0.31 g, P = .016).

Conclusions: SIAH-2 may be a viable target for novel anti-RAS and anticancer agents aimed at inhibiting EGFR and/or RAS-mediated tumorigenesis.


Figures

Figure 1
Figure 1
Seven-in-absentia homolog (SIAH) expression in human lung cancer. A) Immunohistochemistry. Representative images of human lung normal and tumor specimens stained with hemotoxylin–eosin (H & E) and for SIAH (with the 24E6 monoclonal antibody), and epidermal growth factor receptor (EGFR) and phospho-ERK antibodies are shown. Immunochemical staining of cell nuclei (blue) and SIAH, EGFR, or phospho-ERK (brown) are represented in photo images. B) Semiquantitative reverse transcription–polymerase chain reaction (RT–PCR) analysis of SIAH-1 and SIAH-2 expression in human lung epithelial cell lines. The relative expression levels of SIAH-1 and SIAH-2 mRNA transcripts in normal bronchial epithelial cells (BEAS-2B), BEAS-2B transformed with H-RASV12 (BZR), and three lung cancer cells (A549, H727, and UMC11) were estimated semiquantitatively for serial dilutions of the complementary DNA templates. Glyceraldehyde-3-phosphate dehydrogenase (GAPDH) mRNA transcript was used as an internal control. The pcDNA-human-SIAH-1 and pcDNA-human-SIAH-2 plasmids were used as the positive controls for SIAH gene–specific PCR amplification.
Figure 2
Figure 2
Seven-in-absentia homolog (SIAH) expression and cell proliferation. A) Immunochemical staining of ovarian surface epithelial (OSE) cells with SIAH monoclonal antibody (mAb). OSE cells expressing a temperature-sensitive SV40 large T antigen were cultured at 34°C for nine passages and then switched (day 0) to 39°C for 3 d. Cells were stained for SIAH expression with 24E6H3. The experiments were done in triplicate under each condition. A) A bar graph (left graph) and scatter plot (right graph) were used to show the mean percentage of SIAH-positive cells at 39°C for 0–3 d. For the bar graph, the solid bars represent the mean percentage of SIAH-positive cells under each condition and the error bars in left graph represent 95% confidence intervals. For the scatter plot, the small horizontal lines represent the mean percentage of SIAH-positive cells under each condition and the dots represent the actual percentage of SIAH-positive staining in triplicate on each slide. Comparison between groups was performed by Student t test. *Statistically significant difference in SIAH expression was observed between cells in a nonproliferative state compared with the control cells at a proliferative state (P < .001). B) SIAH expression in response to lethal radiation and serum starvation. Immunofluorescence microscopy with the 24E6H3 mAb (green) was used to detect SIAH in human lung cancer A549 cells grown under subconfluent conditions (control), in A549 cells lethally radiated at 20 Gy (20 Gy g-radiation), and in A549 cells cultured for 2 d in the absence of serum (starvation). 4′-6-diamidino-2-phenylindole (DAPI) was used to stain DNA (blue) in the nuclei. Rhodamine-conjugated phalloidin (red) was used to bind F-actin and illustrate the actin cytoskeleton network in the fixed cells. The merged images showed the distinct subcellular localizations of SIAH, DNA, and actin fibers. C) Cell cycle profile of unirradiated A549 cells grown under normal tissue culture conditions. Note the prominent G1 peak. D) Cell cycle profile of lethally irradiated A549 cells. Note the prominent G2 peak. E) SIAH expression in human cancer specimens before (top panel) and after (bottom panel) radiation therapy. Hematoxylin–eosin (H & E) staining was used to view tissue morphology and cell histology of an invading metastatic colorectal cancer in the lung of a patient. The stroma shows little staining, an indication that the anti-SIAH mAb stains specific for proliferating cells and no background staining is detected in noncancerous tissues. Ki67, a well-established clinical marker for cell proliferation, was used to stain the tumor tissues and used as a reference system for SIAH staining. Immunochemical staining of cell nuclei (blue) and SIAH and Ki67 (brown) are represented in photo images.
Figure 3
Figure 3
Silencing of seven-in-absentia homolog (SIAH)-1 and SIAH-2 mRNA and protein expression by pLenti-short hairpin RNA (shRNA) viruses and suppression of anchorage-independent cell growth in SIAH-2–deficient A549 cells. A) Lentiviral-shRNA knockdown system to silence SIAH-1 and SIAH-2 mRNA expression in A549 cells. Semiquantitative reverse transcription–polymerase chain reaction was used to quantify the extent of gene-specific knockdown of SIAH mRNA transcripts in human lung cancer A549 cells using either SIAH-1 or SIAH-2 gene–specific lentiviral constructs (#3 and #6). pLenti-viral–mediated SIAH-1 and SIAH-2–specific knockdown was shown. Untreated and nontarget shRNA control were used as controls to examine the endogenous SIAH-1 and SIAH-2 mRNA transcript expression levels in A549 cells. The pcDNA-SIAH-1 and pcDNA-SIAH-2 plasmids were used as positive controls and double-distilled H2O (ddH2O) was used as a negative control for gene-specific PCR reaction. The glyceraldehyde-3-phosphate dehydrogenase (GAPDH) mRNA was used as an internal control for mRNA quality and loading control. B) Endogenous SIAH staining. A549 cells were infected with the pLenti-shRNA control or pLenti-shRNA SIAH constructs (SIAH-1#3 and SIAH-2#6) alone or in combination and endogenous SIAH expression level was examined at 72 h after infection using anti-SIAH 24E6H3 monoclonal antibody (mAb) (green) by immunofluorescent staining. Nuclei were counterstained with DAPI (blue). C) Anchorage-independent cell growth assay. A549 cells were infected with each of the pLenti-shRNA constructs (nontarget shRNA control, shRNA-SIAH-1#3, and shRNA-SIAH-2#6), or with the pLenti-GFP, pLenti-SIAH-2WT-GFP, or pLenti-SIAH-2PD-GFP viruses, and the ability of the infected cells to form colonies in soft agar was assayed. Infected A549 cells (250) were plated into 24-well plates. Total numbers of colonies formed in each well were counted. The assays were conducted in triplicate under each condition, and three independent experiments were performed. Error bars represent 95% confidence intervals. *Statistically significant difference in colony numbers in SIAH-deficient cells (either dominant-negative SIAH-2PD expression or shRNA-SIAH-2#6 knockdown) was observed when compared with either the untreated A549 control or the corresponding lentiviral-infected controls (either pLenti-GFP or shRNA nontarget control) (P < .001). Comparison between groups was performed by two-sided Student t test.
Figure 4
Figure 4
Effect of short hairpin RNA (shRNA)–mediated seven-in-absentia homolog (SIAH)-2 silencing on ERK signaling and the anchorage-independent growth of A549 cells in soft agar. A) Reverse transcription–polymerase chain reaction analysis of SIAH-2 mRNA expression using SIAH-2–specific shRNA knockdown constructs. To demonstrate the specificity and efficiency of the interfering shRNA, we employed multiple pLentiviral-mediated gene-specific shRNA system (pLenti-SIAH-2-shRNA#6, #7, #8, and #9) to silence SIAH-2 mRNA expression and examined the efficiency of SIAH-2–specific knockdown (#6, #7, #8, and #9). B) Immunoblot analysis of endogenous SIAH-2 expression in shRNA knockdown cells. Protein extracts of A549 cells that were infected with four shRNA-SIAH-2–specific knockdown constructs (#6, #7, #8, and #9) for 3 d were immunoblotted with an SIAH-2–specific monoclonal antibody, an antibody specific for the phosphorylated form of ERK, or an antibody against β-actin (as a control for equal loading). (C and D) Anchorage-independent cell growth assay. A549 cells were infected with the pLenti-shRNA constructs (nontarget control, #6, #7, #8, and #9) separately and the RAS-mediated cell transformation and colony formation of these infected cells was assayed in soft agar. In this batch of the shRNA knockdown experiments, the SIAH-2-shRNA#6 knockdown was incomplete and the resultant A549 colonies had a more spread-out colony morphology compared with colonies of the control cells. As a result, we measured colony volumes to reflect the size differences in the colonies formed in the soft agar. C) A bar graph representation of the colony volumes. Infected A549 cells (250) were plated into 24-well plates in triplicate. Fourteen days after plating the cells, 20–30 randomly chosen colonies were measured in each group and their mean colony volumes calculated. Error bars represent 95% confidence intervals. Comparison between groups was performed by Student t test. *Statistically significant reduction in the colony volumes was observed in two SIAH-2-shRNA knockdown A549 cells (# 8 and #9) as compared with the colony volumes of the shRNA nontarget control-infected A549 cells (P < .001). D) The anchorage-independent cell growth of the A549 colonies in the uninfected group and each infection group (shRNA nontarget control, SIAH-2-shRNA knockdown constructs #6, #7, #8, or #9) were sequentially tracked and imagined at the defined locations after plating on soft agar on days 1, 7, and 14.
Figure 5
Figure 5
Apoptosis and MAPK signaling in seven-in-absentia homolog (SIAH)-2–deficient A549 cells. A) Live cell imaging. The GFP and bright field images of pLentiviral-infected A549 cells expressing either GFP or SIAH-2PD-GFP heterogeneously are shown at days 2–9 after infection. The pLentiviral infection rate was close to 100%. Cytotoxicity was apparent at day 2 after infection, and a dramatic decrease in cell number was apparent at days 4–7 in SIAH2PD-expressing A549 cells. B) Immunoblot analysis. A549 cells were mock infected or infected with pLenti-GFP or pLenti-SIAH-2PD viruses. Cell lysates were collected at days 1–5 after infection and alterations in the major signaling pathways downstream of RAS (MEK, ERK, p38, AKT) were examined by immunoblotting. C) Cell death measured by terminal deoxynucleotidyltransferase–mediated UTP end-labeling (TUNEL) assay. The TUNEL assay was performed on pLentiviral-infected A549 cells expressing either GFP or SIAH-2PD-GFP as well as either short hairpin RNA (shRNA) control or SIAH-2-shRNA#6 on day 3 after infection. The TUNEL assays were conducted in triplicate under each infection condition. The TUNEL experiments were repeated three times independently. Error bars represent 95% confidence intervals. Comparison between groups was performed using Student t test. *Statistically significant increases in the percentage of TUNEL-positive cells were observed in SIAH-deficient cells (either SIAH-2-PD [*] or shRNA-SIAH-2#6 [**]) as compared with SIAH-proficient cells (either GFP or shRNA nontarget control) as the referent groups (P < .001). (D and E) Cell death measured by Annexin V staining. Annexin V-PE staining was determined by fluorescence-activated cell sorting (FACS) analysis at 48 h after infection with GFP or SIAH-2PD-GFP lentiviruses. Negative controls are untreated A549 cells. Positive controls are A549 cells that have initiated the apoptotic program upon 5 mM H2O2 treatment for 1 h. D) A bar graph representation of the percentage of Annexin V–positive cells. Annexin V-staining was conducted in triplicate under each condition. The experiment was repeated once. Error bars represent 95% confidence intervals. Comparison between groups was performed using Student t test. *Statistically significant increases in the percentage of Annexin V–positive cells were observed in SIAH-deficient cells (SIAH-2-PD) as compared with SIAH-proficient cells (GFP) as the referent group (with 95% confidence intervals, P = .038). H2O2-induced Annexin V staining was used as a positive control. E) FACS analysis of Annexin V staining. The percentage of apoptotic cells is indicated in the upper right quadrant in the corresponding panel under each experimental condition.
Figure 6
Figure 6
MAPK signaling and cell proliferation in seven-in-absentia homolog (SIAH)–deficient cells. A panel of human normal lung cells, BEAS-2B (A) and lung tumor cells, BZR (B), and the lung cancer cells A549 (C) and H727 (D) were mock infected or infected with pLenti-GFP, pLenti-SIAH-2PD-GFP, pLenti-short hairpin RNA (shRNA)-control, or pLenti-shRNA-SIAH-2#6 viruses using an infection ratio (viruses:cells) of 20:1. Immunoblot analysis of MAPK signaling was analyzed in the resultant cells. Three days after infection, the cell lysates were subjected to immunoblot analysis to examine the effect of SIAH deficiency on MEK/ERK signaling (left panels). Immunoblotting for total actin was performed to confirm equal loading. Cell proliferation assay was performed for each cell line under each infection condition (right panels) in which 10 000 infected cells were plated into each well of a total of 72 wells (three 24-well plates) on day 1 in order to establish one growth curve under each infection condition in triplicates. The total number of cells per well was manually counted over a 7- to 8-d period after viral infection. The experiment was conducted once in triplicate. Mean numbers of cells were plotted. Error bars represent 95% confidence intervals. Comparison between groups was performed using Student t test. *Statistically significant reductions in cell proliferation rates were observed in SIAH-deficient cells (either SIAH-2PD-GFP or shRNA-SIAH-2#6) as compared with SIAH-proficient cells (either GFP or shRNA control) as the corresponding referent groups in BZR, A549, and H727 cells at day 6 and 7 (P < .001).
Figure 6
Figure 6
MAPK signaling and cell proliferation in seven-in-absentia homolog (SIAH)–deficient cells. A panel of human normal lung cells, BEAS-2B (A) and lung tumor cells, BZR (B), and the lung cancer cells A549 (C) and H727 (D) were mock infected or infected with pLenti-GFP, pLenti-SIAH-2PD-GFP, pLenti-short hairpin RNA (shRNA)-control, or pLenti-shRNA-SIAH-2#6 viruses using an infection ratio (viruses:cells) of 20:1. Immunoblot analysis of MAPK signaling was analyzed in the resultant cells. Three days after infection, the cell lysates were subjected to immunoblot analysis to examine the effect of SIAH deficiency on MEK/ERK signaling (left panels). Immunoblotting for total actin was performed to confirm equal loading. Cell proliferation assay was performed for each cell line under each infection condition (right panels) in which 10 000 infected cells were plated into each well of a total of 72 wells (three 24-well plates) on day 1 in order to establish one growth curve under each infection condition in triplicates. The total number of cells per well was manually counted over a 7- to 8-d period after viral infection. The experiment was conducted once in triplicate. Mean numbers of cells were plotted. Error bars represent 95% confidence intervals. Comparison between groups was performed using Student t test. *Statistically significant reductions in cell proliferation rates were observed in SIAH-deficient cells (either SIAH-2PD-GFP or shRNA-SIAH-2#6) as compared with SIAH-proficient cells (either GFP or shRNA control) as the corresponding referent groups in BZR, A549, and H727 cells at day 6 and 7 (P < .001).
Figure 7
Figure 7
Comparison of the phospho-ERK inhibition by the MEK inhibitors, U0126 and PD98059, with the novel anti-seven-in-absentia homolog (SIAH)-2 molecule, SIAH-2PD in A549 cells. A549 cells were infected with GFP or SIAH-2PD-GFP lentiviruses at increasing virus to cell ratios 3 d after infection or treated with MEK1 inhibitor, PD98059 and MEK inhibitor, U0126 at increasing drug concentrations for 16 h. Immunoblot analyses were performed 3 d after A549 cells were infected with serial dilutions of GFP or SIAH2PD-GFP lentiviruses at the indicated infection ratios or treated for 16 h with either dimethyl sulfoxide (DMSO) as the negative control or serial dilutions of the MEK inhibitors PD98059 or U0126 at the indicated concentrations. Phosphorylation and activation status of ERK1 and ERK2 in the presence of anti-SIAH-2 molecules (SIAH-2PD) and/or MEK inhibitors was examined by immunoblotting with an antibody specific for the phosphorylated form of ERK. Cell lysates were also immunoblotted with anti-FLAG monoclonal antibody (mAb) to detect the exogenous SIAH-2PD expression and with an antibody against unphosphorylated form of ERK1 and ERK2 as a control for equal loading.
Figure 8
Figure 8
Effect of seven-in-absentia homolog (SIAH)-2PD expression on A549 tumor growth in athymic nude mice. A549 cells (1 × 10⁶) that were uninfected or infected with pLenti-eGFP or pLenti-SIAH-2PD–5′FLAG-GFP (SIAH-2PD) were injected subcutaneously into the right and left flanks of 5-week-old male athymic nude mice (n = 10 mice per group, two injections per mouse, and 20 tumors were formed at 100% take rate). A) A549 tumor growth curves based on the measurement of tumor volumes are shown. Error bars represent 95% confidence intervals. Comparison between groups was performed using Student t test using the averaged tumor weights and volumes per mouse (10 mice total, two tumors per mouse). *Statistically significant reductions in tumor volumes were observed in SIAH-deficient A549 tumors (SIAH-2PD) as compared with untreated A549 tumors as a referent group (P < .001) or compared with the SIAH-proficient tumors (GFP control) as a referent group (P = .003). B) Tumor weight. The mean tumor mass after surgical resection is plotted. Error bars represent 95% confidence intervals. Comparison between groups was performed by Student t test. C) Live cell imaging of pLenti-GFP or pLenti-SIAH-2PD-GFP–infected A549 cells before subcutaneous injection into the nude mice. The GFP and bright field images of A549 cells infected with high-titer GFP or SIAH-2PD-GFP lentiviruses are shown at days 2 and 3 after infection prior injection into the nude mice. The pLentiviral infection rate was close to 95% in the infected A549 cell population after GFP-positive cells were counted. D) Live cell imaging of A549 tumor–derived cell lines after surgical resection. The GFP and bright field images of cell lines derived from A549 tumors resulting from injected A549 cells. Independent cell lines (n = 4–5) were generated from the independent A549 tumors resected from nude mice. All of the five A549 tumor–derived cell lines originated from GFP-infected A549 cells maintained their GFP expression stably (GFP cell line #1 and #2) while a substantial amount of GFP-negative cells was observed in the cell lines derived from the SIAH-2PD-GFP–infected tumors. For example, three out of four of the tumor-derived A549 cell lines had completely lost either SIAH-2PD or both SIAH-2PD and GFP expression (SIAH-2PD-cell line #2). E) Immunoblot analysis of A549 tumor lysates. Independent A549 tumor lysates from GFP and SIAH-2PD-GFP groups were immunoblotted with antibodies specific for FLAG to detect the exogenous SIAH-2PD expression, phosphorylated form of ERK to detect the activated forms of ERK1/2 proteins, ERK1/2 to detect pan-ERK expression, p21 cell cycle inhibitor to detect cell cycle inhibition. Blots were probed with an anti-actin antibody to confirm equal loading.

References

    1. Travis WD, Brambilla E, Muller-Hermelink HK, Harris CC, editors. World Health Organization Classification of Tumours: Pathology & Genetics: Tumours of the Lung, Pleura, Thymus and Heart. IARC Press; 2004.
    1. Parkin DM, Bray F, Ferlay J, Pisani P. Global cancer statistics, 2002. CA Cancer J Clin. 2005;55(2):74–108. - PubMed
    1. Jemal A, Siegel R, Ward E, et al. Cancer statistics, 2008. CA Cancer J Clin. 2008;58(2):71–96. - PubMed
    1. Sun S, Schiller JH, Gazdar AF. Lung cancer in never smokers—a different disease. Nat Rev Cancer. 2007;7(10):778–790. - PubMed
    1. Sharma SV, Bell DW, Settleman J, Haber DA. Epidermal growth factor receptor mutations in lung cancer. Nat Rev Cancer. 2007;7(3):169–181. - PubMed

Publication types

MeSH terms