

Effect of dietary monosodium glutamate on trans fat-induced nonalcoholic fatty liver disease
- PMID: 19001666
- PMCID: PMC2724042
- DOI: 10.1194/jlr.M800418-JLR200
Effect of dietary monosodium glutamate on trans fat-induced nonalcoholic fatty liver disease
Abstract
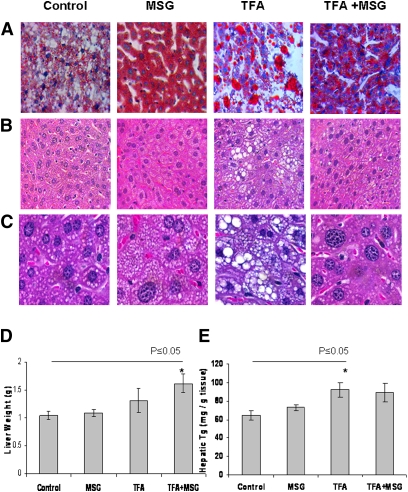
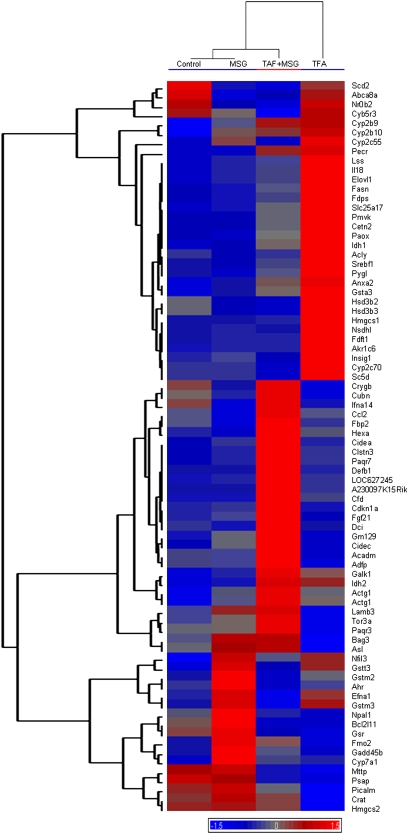
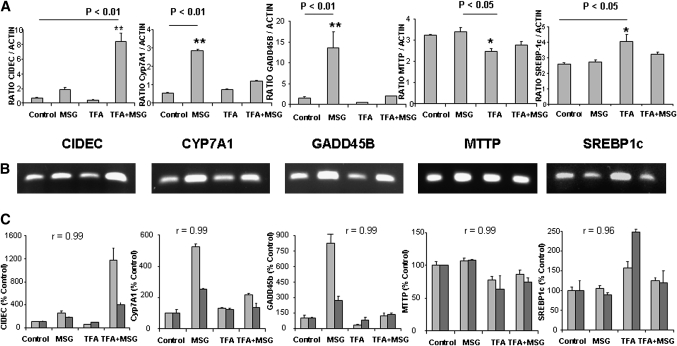
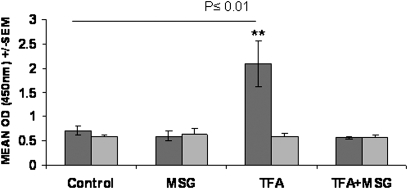
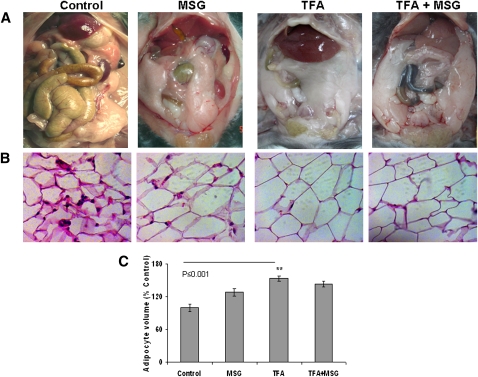
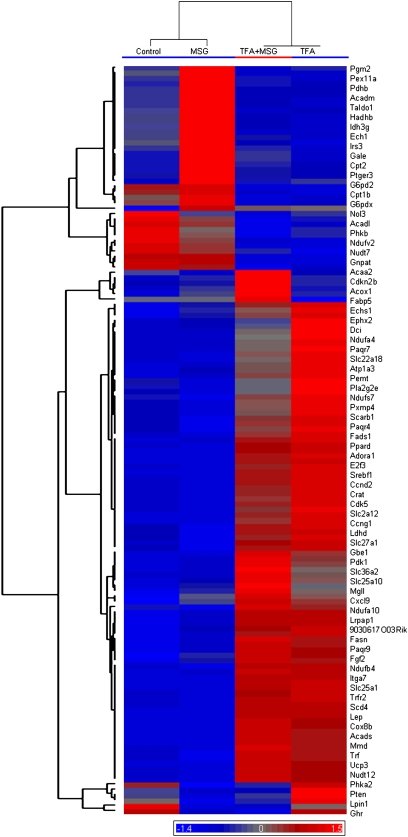
The effects of dietary monosodium glutamate (MSG) on trans-fatty acid (TFA)-induced nonalcoholic fatty liver disease (NAFLD) are addressed in an animal model. We used Affymetrix microarray analysis to investigate hepatic gene expression and the contribution of visceral white adipose tissue (WAT) to diet-induced NAFLD. Trans-fat feeding increased serum leptin, FFA, HDL-cholesterol (HDL-C), and total cholesterol (T-CHOL) levels, while robustly elevating the expression of genes involved in hepatic lipogenesis, including the transcription factor sterol-regulatory element binding protein 1c. Histological examination revealed hepatic macrosteatosis in TFA-fed animals. Conversely, dietary MSG at doses similar to human average daily intake caused hepatic microsteatosis and the expression of beta-oxidative genes. Serum triglyceride, FFA, and insulin levels were elevated in MSG-treated animals. The abdominal cavities of TFA- or MSG-treated animals had increased WAT deposition compared with controls. Microarray analysis of WAT gene expression revealed increased lipid biosynthetic gene expression, together with a 50% decrease in the key transcription factor Ppargc1a. A combination of TFA+MSG resulted in the highest levels of serum HDL-C, T-CHOL, and leptin. Microarray analysis of TFA+MSG-treated livers showed elevated expression of markers of hepatic inflammation, lipid storage, cell damage, and cell cycle impairment. TFA+MSG mice also had a high degree of WAT deposition and lipogenic gene expression. Levels of Ppargc1a were further reduced to 25% by TFA+MSG treatment. MSG exacerbates TFA-induced NAFLD.
Figures
Similar articles
-
Effect of dietary monosodium glutamate on HFCS-induced hepatic steatosis: expression profiles in the liver and visceral fat.Obesity (Silver Spring). 2010 Jun;18(6):1122-34. doi: 10.1038/oby.2009.502. Epub 2010 Jan 28. Obesity (Silver Spring). 2010. PMID: 20111022
-
Prediabetic changes in gene expression induced by aspartame and monosodium glutamate in Trans fat-fed C57Bl/6 J mice.Nutr Metab (Lond). 2013 Jun 19;10:44. doi: 10.1186/1743-7075-10-44. eCollection 2013. Nutr Metab (Lond). 2013. PMID: 23783067 Free PMC article.
-
Dietary trans-fat combined with monosodium glutamate induces dyslipidemia and impairs spatial memory.Physiol Behav. 2010 Mar 3;99(3):334-42. doi: 10.1016/j.physbeh.2009.11.010. Epub 2009 Nov 27. Physiol Behav. 2010. PMID: 19945473
-
Trans fatty acids: effects on cardiometabolic health and implications for policy.Prostaglandins Leukot Essent Fatty Acids. 2008 Sep-Nov;79(3-5):147-52. doi: 10.1016/j.plefa.2008.09.008. Epub 2008 Nov 8. Prostaglandins Leukot Essent Fatty Acids. 2008. PMID: 18996687 Free PMC article. Review.
-
Trans fatty acids and cardiovascular risk: a unique cardiometabolic imprint?Curr Atheroscler Rep. 2007 Dec;9(6):486-93. doi: 10.1007/s11883-007-0065-9. Curr Atheroscler Rep. 2007. PMID: 18377789 Review.
Cited by
-
Obesity, Diabetes Mellitus, and Vascular Impediment as Consequences of Excess Processed Food Consumption.Cureus. 2022 Sep 4;14(9):e28762. doi: 10.7759/cureus.28762. eCollection 2022 Sep. Cureus. 2022. PMID: 36105908 Free PMC article. Review.
-
Dietary Composition Independent of Weight Loss in the Management of Non-Alcoholic Fatty Liver Disease.Nutrients. 2017 Jul 26;9(8):800. doi: 10.3390/nu9080800. Nutrients. 2017. PMID: 28933748 Free PMC article. Review.
-
NASH: Thiazolidinediones for NASH--one pill doesn't fix everything.Nat Rev Gastroenterol Hepatol. 2010 May;7(5):243-4. doi: 10.1038/nrgastro.2010.50. Nat Rev Gastroenterol Hepatol. 2010. PMID: 20442730 No abstract available.
-
The trans fatty acid elaidate affects the global DNA methylation profile of cultured cells and in vivo.Lipids Health Dis. 2016 Apr 12;15:75. doi: 10.1186/s12944-016-0243-2. Lipids Health Dis. 2016. PMID: 27068706 Free PMC article.
-
Microbiota and Transcriptomic Effects of an Essential Oil Blend and Its Delivery Route Compared to an Antibiotic Growth Promoter in Broiler Chickens.Microorganisms. 2022 Apr 21;10(5):861. doi: 10.3390/microorganisms10050861. Microorganisms. 2022. PMID: 35630307 Free PMC article.
References
-
- Targher G.2007. Non-alcoholic fatty liver disease, the metabolic syndrome and the risk of cardiovascular disease: the plot thickens. Diabet. Med. 24: 1–6 - PubMed
-
- Luyckx F. H., Lefebvre P. J., Scheen A. J. 2000. Non-alcoholic steatohepatitis: association with obesity and insulin resistance, and influence of weight loss. Diabetes Metab. 26: 98–106 - PubMed
-
- Solis-Herruzo J. A., Garcia-Ruiz I., Perez-Carreras M., Munoz-Yague M. T. 2006. Non-alcoholic fatty liver disease. From insulin resistance to mitochondrial dysfunction. Rev. Esp. Enferm. Dig. 98: 844–874 - PubMed
-
- Cave M., Deaciuc I., Mendez C., Song Z., Joshi-Barve S., Barve S., McClain C. 2007. Nonalcoholic fatty liver disease: predisposing factors and the role of nutrition. J. Nutr. Biochem. 18: 184–195 - PubMed
-
- Dunn W., Schwimmer J. B. 2008. The obesity epidemic and nonalcoholic fatty liver disease in children. Curr. Gastroenterol. Rep. 1: 67–72 - PubMed
Publication types
MeSH terms
Substances
LinkOut - more resources
Full Text Sources
Other Literature Sources
Medical
