

Measuring mucosal blood supply in vivo with a polarization-gating probe
- PMID: 19002229
- PMCID: PMC2728617
- DOI: 10.1364/ao.47.006046
Measuring mucosal blood supply in vivo with a polarization-gating probe
Abstract
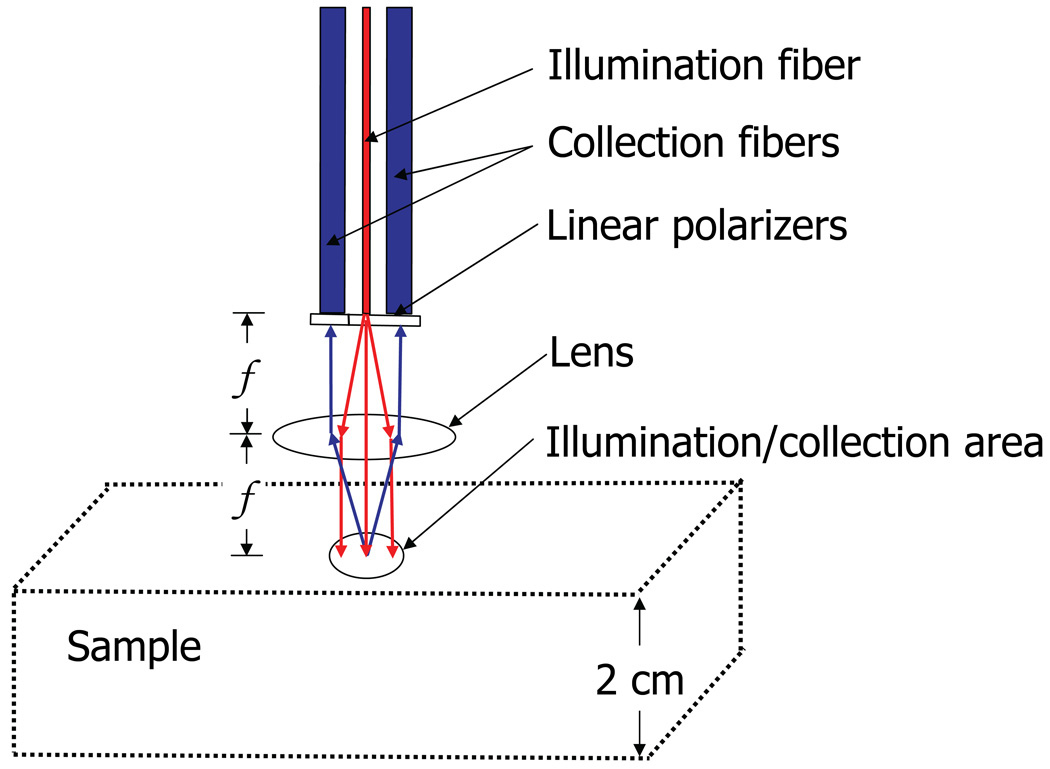
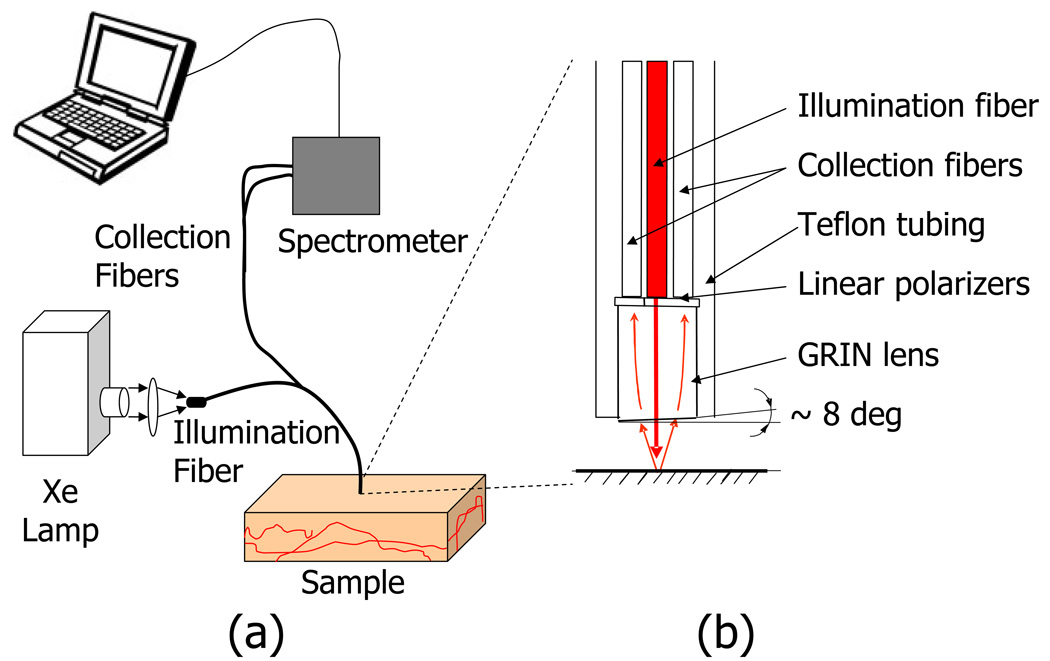
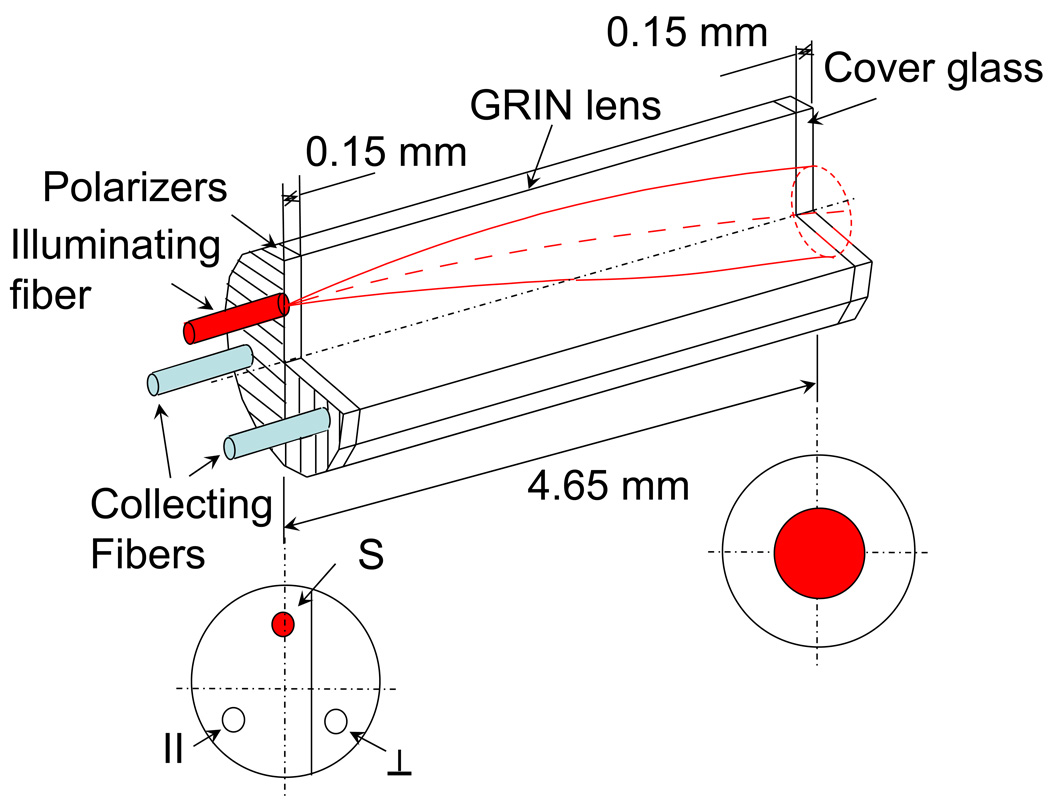
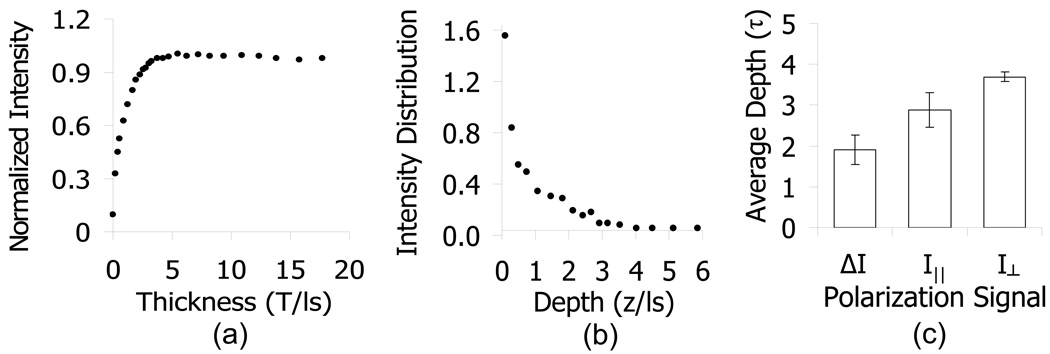
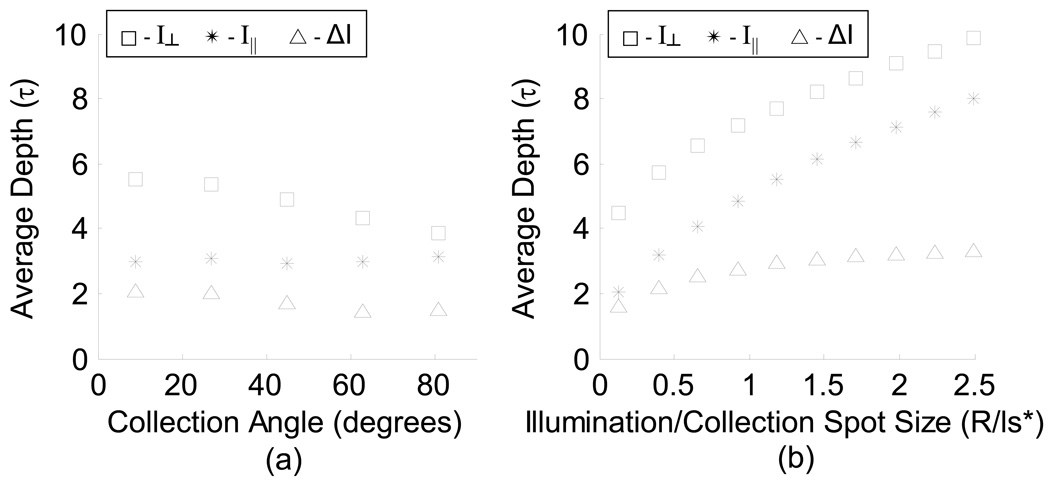
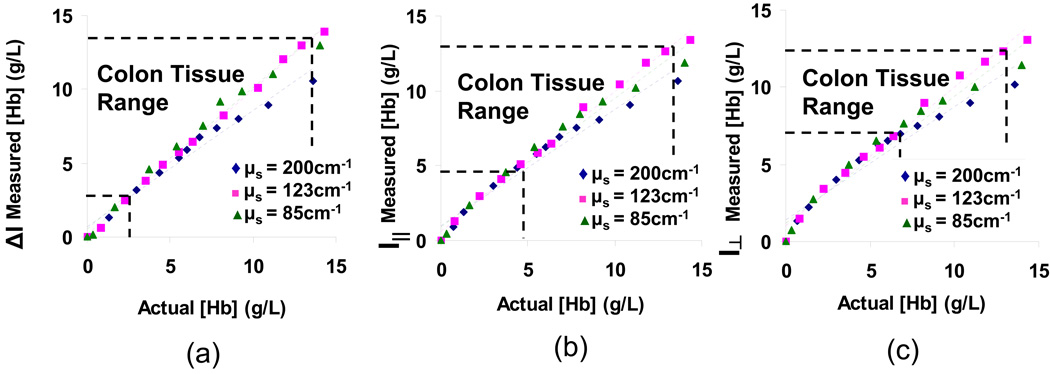
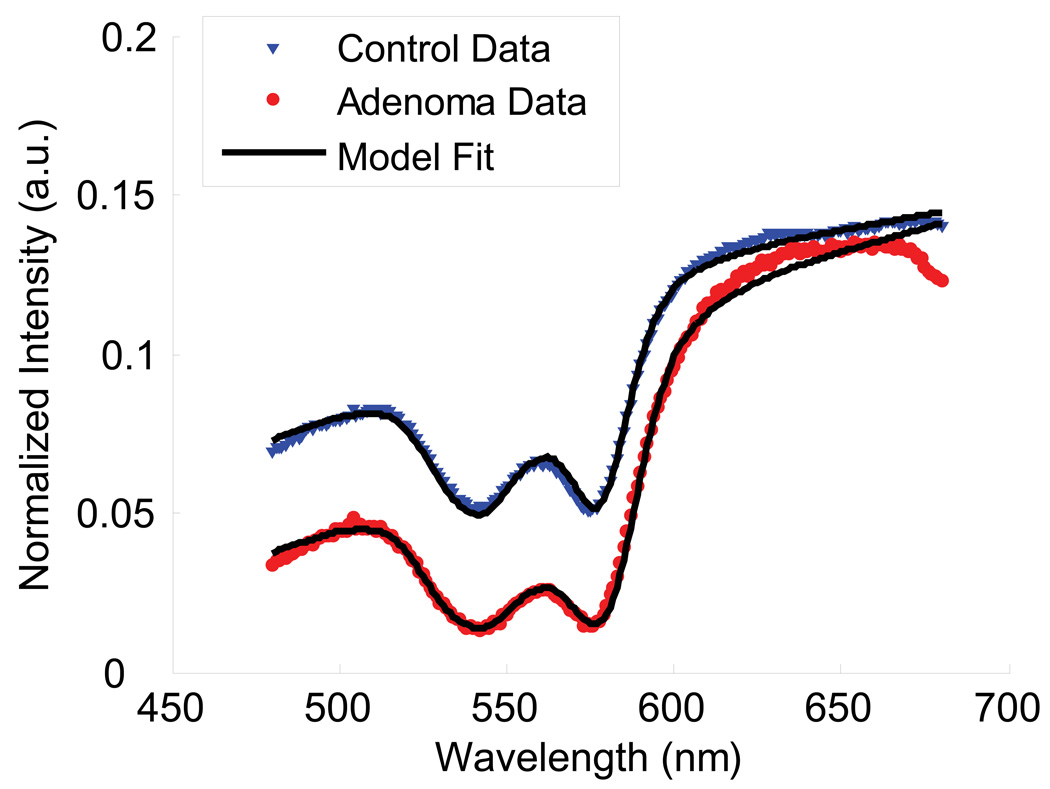
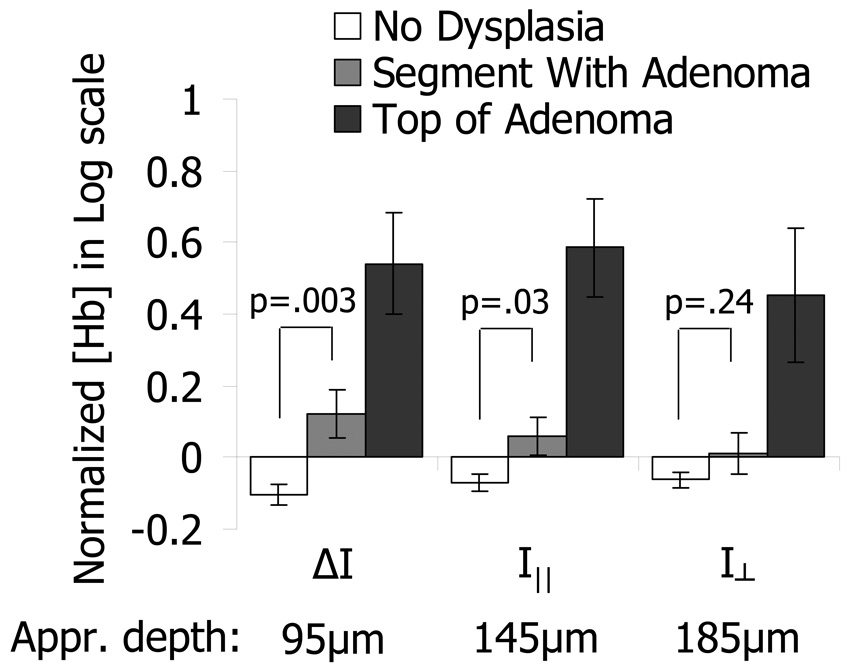
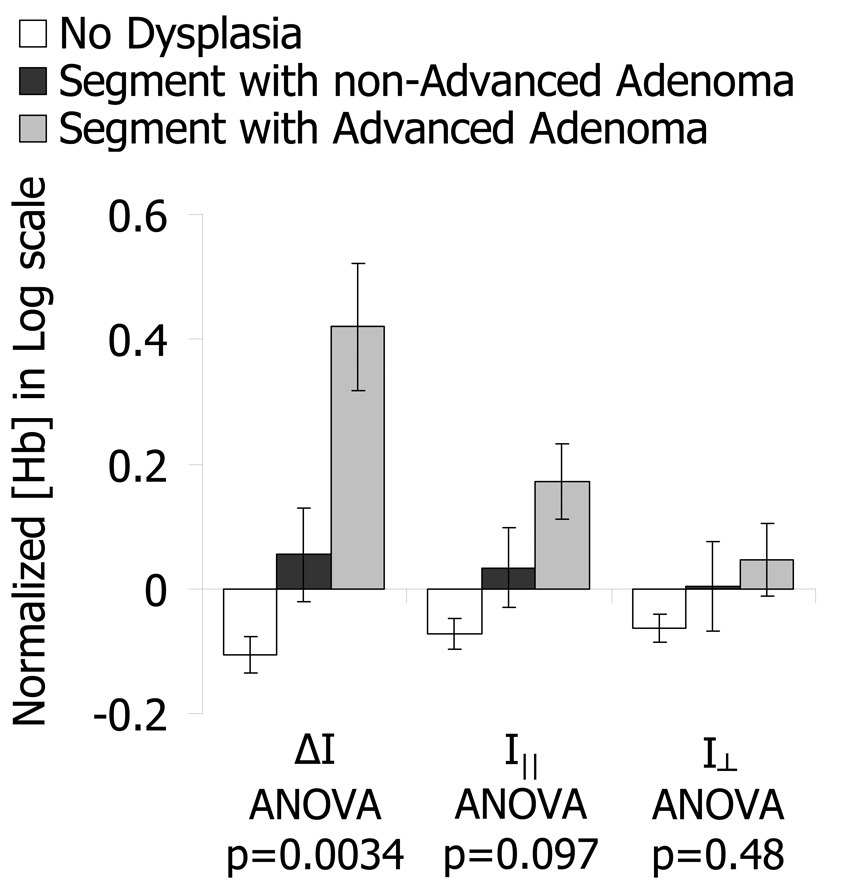
There has been significant interest in developing depth-selective optical interrogation of biological tissue in general and of superficial (e.g., mucosal) tissue in particular. We report an in vivo polarization-gating fiber-optic probe that obtains backscattering spectroscopic measurements from a range of near-surface depths (100-200 microm). The design and testing was performed with polarized light Monte Carlo simulations and in tissue model experiments. We used the probe to investigate mucosal changes in early carcinogenesis. Measurements performed in the colonic mucosa of 125 human subjects provide the first in vivo evidence that mucosal blood supply is increased early in carcinogenesis, not only in precancerous adenomatous lesions, but also in the histologically normal-appearing tissue surrounding these lesions. This effect was primarily limited to the mucosal microcirculation and was not present in the larger blood vessels located deeper in colonic tissue.
Figures
Similar articles
-
Spectroscopic microvascular blood detection from the endoscopically normal colonic mucosa: biomarker for neoplasia risk.Gastroenterology. 2008 Oct;135(4):1069-78. doi: 10.1053/j.gastro.2008.06.046. Epub 2008 Jun 25. Gastroenterology. 2008. PMID: 18722372 Free PMC article. Clinical Trial.
-
Increased microvascular blood content is an early event in colon carcinogenesis.Gut. 2005 May;54(5):654-60. doi: 10.1136/gut.2004.056010. Gut. 2005. PMID: 15831911 Free PMC article.
-
Analytical model of light reflectance for extraction of the optical properties in small volumes of turbid media.Appl Opt. 2007 Oct 10;46(29):7317-28. doi: 10.1364/ao.46.007317. Appl Opt. 2007. PMID: 17932546
-
Measurement of the spatial backscattering impulse-response at short length scales with polarized enhanced backscattering.Opt Lett. 2011 Dec 15;36(24):4737-9. doi: 10.1364/OL.36.004737. Opt Lett. 2011. PMID: 22179867 Free PMC article.
-
In Vivo Observations of Rapid Scattered Light Changes Associated with Neurophysiological Activity.In: Frostig RD, editor. In Vivo Optical Imaging of Brain Function. 2nd edition. Boca Raton (FL): CRC Press/Taylor & Francis; 2009. Chapter 5. In: Frostig RD, editor. In Vivo Optical Imaging of Brain Function. 2nd edition. Boca Raton (FL): CRC Press/Taylor & Francis; 2009. Chapter 5. PMID: 26844322 Free Books & Documents. Review.
Cited by
-
Depth-selective fiber-optic probe for characterization of superficial tissue at a constant physical depth.Biomed Opt Express. 2011 Mar 14;2(4):838-49. doi: 10.1364/BOE.2.000838. Biomed Opt Express. 2011. PMID: 21483607 Free PMC article.
-
Visible light optical spectroscopy is sensitive to neovascularization in the dysplastic cervix.J Biomed Opt. 2010 Sep-Oct;15(5):057006. doi: 10.1117/1.3495730. J Biomed Opt. 2010. PMID: 21054122 Free PMC article.
-
Fully automated fiber-based optical spectroscopy system for use in a clinical setting.J Biomed Opt. 2018 Jul;23(7):1-10. doi: 10.1117/1.JBO.23.7.075003. J Biomed Opt. 2018. PMID: 29981224 Free PMC article.
-
Detection of precancerous lesions in the oral cavity using oblique polarized reflectance spectroscopy: a clinical feasibility study.J Biomed Opt. 2017 Jun 1;22(6):65002. doi: 10.1117/1.JBO.22.6.065002. J Biomed Opt. 2017. PMID: 28609512 Free PMC article.
-
Light-scattering technologies for field carcinogenesis detection: a modality for endoscopic prescreening.Gastroenterology. 2011 Jan;140(1):35-41. doi: 10.1053/j.gastro.2010.11.023. Epub 2010 Nov 12. Gastroenterology. 2011. PMID: 21078318 Free PMC article.
References
-
- Shpitz B, Gochberg S, Neufeld D, Grankin M, Buklan G, Klein E, Bernheim J. Angiogenic switch in earliest stages of human colonic tumorigenesis. Anticancer Res. 2003;23:5153–5157. - PubMed
-
- Hanahan D, Folkman J. Patterns and emerging mechanisms of the angiogenic switch during tumorigenesis. Cell. 1996;86:353–364. - PubMed
-
- Siegel MP, Kim YL, Roy HK, Wali RK, Backman V. Assessment of blood supply in superficial tissue by polarization-gated elastic light-scattering spectroscopy. Appl Optics. 2006;45:335–342. - PubMed
-
- Braakhuis BJM, Tabor MP, Kummer JA, Leemans CR, Brakenhoff RH. A genetic explanation of Slaughter's concept of field cancerization: Evidence and clinical implications. Cancer Res. 2003;63:1727–1730. - PubMed
Publication types
MeSH terms
Substances
Grants and funding
LinkOut - more resources
Full Text Sources
Other Literature Sources
