

A confidence interval for the wallace coefficient of concordance and its application to microbial typing methods
- PMID: 19002246
- PMCID: PMC2577298
- DOI: 10.1371/journal.pone.0003696
A confidence interval for the wallace coefficient of concordance and its application to microbial typing methods
Abstract
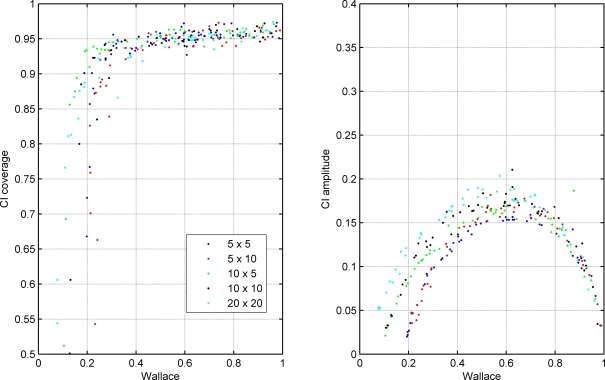
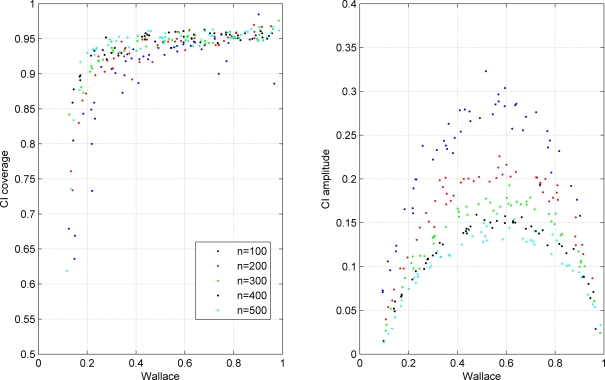
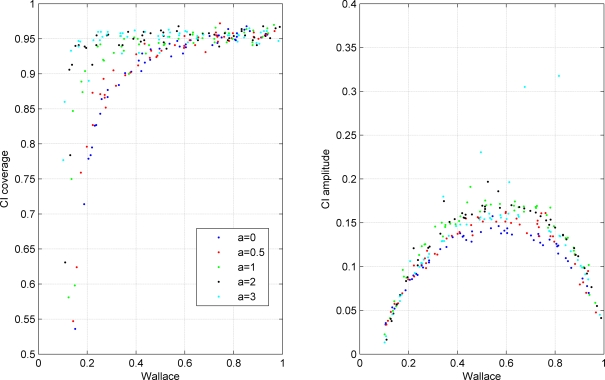
Very diverse research fields frequently deal with the analysis of multiple clustering results, which should imply an objective detection of overlaps and divergences between the formed groupings. The congruence between these multiple results can be quantified by clustering comparison measures such as the Wallace coefficient (W). Since the measured congruence is dependent on the particular sample taken from the population, there is variability in the estimated values relatively to those of the true population. In the present work we propose the use of a confidence interval (CI) to account for this variability when W is used. The CI analytical formula is derived assuming a Gaussian sampling distribution and recurring to the algebraic relationship between W and the Simpson's index of diversity. This relationship also allows the estimation of the expected Wallace value under the assumption of independence of classifications. We evaluated the CI performance using simulated and published microbial typing data sets. The simulations showed that the CI has the desired 95% coverage when the W is greater than 0.5. This behaviour is robust to changes in cluster number, cluster size distributions and sample size. The analysis of the published data sets demonstrated the usefulness of the new CI by objectively validating some of the previous interpretations, while showing that other conclusions lacked statistical support.
Conflict of interest statement
Figures
References
-
- Meila M. Comparing clusterings by the variation of information. 2003. pp. 173–187. LEARNING THEORY AND KERNEL MACHINES.
-
- Steinley D. Properties of the Hubert-Arabie adjusted Rand index. Psychol Methods. 2004;9:386–396. - PubMed
-
- Camiz S, Pillar V. Comparison of single and complete linkage clustering with the hierarchical factor classification of variables. Community Ecology. 2007;8:25–30.
-
- Wallace DL. Comment. Journal of the American Statistical Association. 1983;78:569–576.
Publication types
MeSH terms
LinkOut - more resources
Full Text Sources
