. 2008;3(11):e3697.
doi: 10.1371/journal.pone.0003697. Epub 2008 Nov 11.

Evolving synaptic plasticity with an evolutionary cellular development model

Affiliations

Evolving synaptic plasticity with an evolutionary cellular development model

Uri Yerushalmi et al. PLoS One. 2008.

Abstract

Since synaptic plasticity is regarded as a potential mechanism for memory formation and learning, there is growing interest in the study of its underlying mechanisms. Recently several evolutionary models of cellular development have been presented, but none have been shown to be able to evolve a range of biological synaptic plasticity regimes. In this paper we present a biologically plausible evolutionary cellular development model and test its ability to evolve different biological synaptic plasticity regimes. The core of the model is a genomic and proteomic regulation network which controls cells and their neurites in a 2D environment. The model has previously been shown to successfully evolve behaving organisms, enable gene related phenomena, and produce biological neural mechanisms such as temporal representations. Several experiments are described in which the model evolves different synaptic plasticity regimes using a direct fitness function. Other experiments examine the ability of the model to evolve simple plasticity regimes in a task -based fitness function environment. These results suggest that such evolutionary cellular development models have the potential to be used as a research tool for investigating the evolutionary aspects of synaptic plasticity and at the same time can serve as the basis for novel artificial computational systems.


Conflict of interest statement

Competing Interests: The authors have declared that no competing interests exist.

Figures

Figure 1
Figure 1. Example of a schematic simple-regulation network derived from a 6-gene chromosome.
gA–gF are genes and A–F are their corresponding transcripted proteins. Proteins B, D & F act as productive proteins of C, B & E respectively. The white arrows represent production connections whereas the black arrows represent activation connections. Protein E can be produced inside the cell by its gene gE, and out of the cell by protein F, generating a cascading information system where E plays the role of a ligand, D is its receptor, and B and C are the internal messengers that eventually activate gene gC.
Figure 2
Figure 2. Synapsogenesis scheme example.
A) The basic building plan for the cellular tissue is the chromosome. B) The chromosome is translated into a zygote controlled by a regulatory network. C) A mitosis event splits the zygote into two separate cells, where each cell has its own instance of the same regulatory network template. D) Neurite sprouting events occur in both cells. An axon is branched from the left cell, and a dendrite – from the right cell. Proteins a and b are marked in P11 as ones that cannot diffuse from neurite to soma. Therefore, their instances are separated into neurites with the same connectivity. E) After the axon is guided by external protein concentrations towards the right cell's dendrite, a ‘synapsogenesis’ event occurs. A synapse is formed, allowing proteins marked as synapse-diffusible (in their ktype parameter) to move from one cell to another.
Figure 3
Figure 3. Outcome of the first period in the direct fitness function experiments.
The outcome of the first period in the direct fitness function experiments is a dual cell organism in which a synapse was formed between an axon of one cell and the dendrite of the other. The grey circles represent the somas of two cells. The smaller white circles represent axons and dendrites. The internal networks represent the gene-protein networks in each soma, axon or dendrite that all have the same connections, but may have different states.
Figure 4
Figure 4. An example of a simple organism developed in the behavior- based experiment.
A simple organism developed in the behavior- based experiment. This specific organism has two (bottom) motor cells, which synapse to a hidden cell (middle), which synapse to a sensor cell (top). The large circles represent somas of cells, the smaller white circles represent axons and dendrites. The internal networks represent the gene-protein networks in each soma, axon or dendrite that all have the same connections, but may have different states.
Figure 5
Figure 5. The first evolution period in the direct fitness function experiments.
The process of evolving organisms in the first period in the direct fitness function experiments. Twenty eight generations were randomly selected through evolution. Blue line indicates the average fitness in each generation; purple lines indicate error range of one standard deviation.
Figure 6
Figure 6. Average synaptic change plotted against spike time measures in Hebbian- like LTP fitness sessions.
Hebbian- like LTP plasticity; synaptic change plotted against Δst (defined as the interval between the pre-synaptic spike and the post-synaptic spike), taken from a 30th generation virtual organism evolved in a session with fitness function formula image. Spike time measures are given in system epochs, synaptic change Δwt is given in absolute synaptic weight values. Each plot presents the average synaptic change values from 24 sessions of 1000 epochs. The error bars are set at one standard deviation.
Figure 7
Figure 7. Average synaptic change plotted against spike time measures in the Anti-Hebbian-like LTD fitness sessions.
Anti-Hebbian-like LTD plasticity; synaptic change plotted against Δst, taken from a 30th generation virtual organism evolved in a session with fitness function formula image. Spike time measures are given in system epochs; synaptic change Δwt is given in absolute synaptic weight values. Each plot presents the average synaptic change values from 24 sessions of 1000 epochs. The error bars are set at one standard deviation.
Figure 8
Figure 8. Fitness curve of evolving Hebbian LTP synapses using the direct fitness function.
Average fitness values in every generation for the eight sessions running the Hebbian- like LTP fitness function. The first generation is the outcome of an evolutionary session designed to evolve organisms with only two neurons and a single synapse between them as detailed in the text.
Figure 9
Figure 9. Fitness curve of evolving Anti-Hebbian LTD synapses using the direct fitness function.
Average fitness values in every generation for the 8 sessions running the Hebbian- like LTD fitness function. The first generation is the outcome of an evolutionary session designed to evolve organisms with only two neurons and a single synapse between them as detailed in the text.
Figure 10
Figure 10. Average synaptic change plotted against spike time measures in Non-Hebbian LTP pre-synaptic plasticity fitness sessions.
Non-Hebbian LTP pre-synaptic plasticity; synaptic change plotted against formula image 
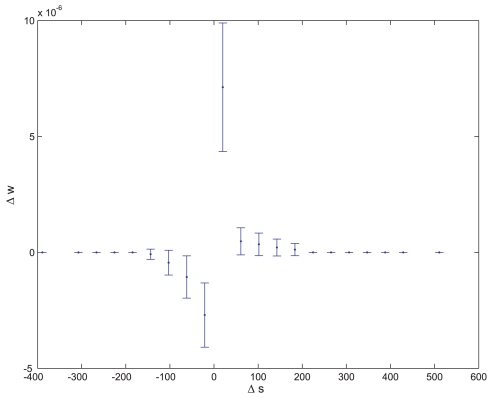
(defined as the time interval since the last pre-synaptic spike), taken from a 20th generation virtual organism evolved in a session with fitness function formula image. The post-synaptic cell was set as non-active during measurements. Spike time measures are given in system epochs; synaptic change Δwt is given in absolute synaptic weight values. Each plot presents the average synaptic change values from 24 sessions of 1000 epochs. The error bars are of one standard deviation.
Figure 11
Figure 11. Average synaptic change plotted against spike time measures in Non-Hebbian LTP post synaptic plasticity fitness sessions.
Non-Hebbian LTP post-synaptic plasticity; synaptic change plotted against formula image (defined as the time interval since the last post-synaptic spike), taken from a 20th generation virtual organism evolved in a session with fitness function formula image. The pre-synaptic cell was set as non -active during measurements. Spike time measures are given in system epochs; synaptic change Δwt is given in absolute synaptic weight values. Each plot presents the average synaptic change values from 24 sessions of 1000 epochs. The error bars are set atone standard deviation.
Figure 12
Figure 12. Fitness curve of evolving Non-Hebbian LTP pre- synaptic synapses using the direct fitness function.
Average fitness values in every generation for the eight sessions running the Non-Hebbian pre-synaptic LTP fitness function. The first generation is the outcome of an evolutionary session designed to evolve organisms with only two neurons and a single synapse between them as detailed in the text.
Figure 13
Figure 13. Fitness curve of evolving Non-Hebbian LTP pre synaptic synapses using the direct fitness function.
Average fitness values in every generation for the eight sessions running the Non-Hebbian post-synaptic LTP fitness function. The first generation is the outcome of an evolutionary session designed to evolve organisms with only two neurons and a single synapse between them as detailed in the text.
Figure 14
Figure 14. Fitness curve of evolving STDP synapses.
Average fitness values in every generation for the eight sessions running the STDP fitness function. The first generation is the outcome of an evolutionary session designed to evolve organisms with only two neurons and a single synapse between them as detailed in the text.
Figure 15
Figure 15. Hebbian- like STDP.
Synaptic change plotted against Δst, taken from a 400th generation virtual organism evolved in a session with fitness function:Spike time measures are given in system epochs; synaptic change Δwt is given in absolute synaptic weight values. Each plot presents the average synaptic change values from 24 sessions of 1000 epochs. The error bars are set at one standard deviation.
Figure 16
Figure 16. Evolution in behavioral experiment.
Green: Proportion of reproduction triggered by virtual organisms contacting each other (as opposed to reproductions initiated by the system when the number of virtual organisms hit the lower bound). Blue: Proportion of virtual organisms that developed a basic network as defined in the text. Red: Proportion of virtual organism death events triggered by the system because of crowding (as opposed to deaths due to completing the life span period). The values are average proportions measured every 10 generations.
Figure 17
Figure 17. An organism with a simple memory mechanism of sensed potential mates.
One of the developed organisms included a sensory neuron A that was sensitive to mate odors, synapsing a hidden neuron B, synapsing using a Non-Hebbian pre-synaptic LTP synapse S, a hidden neuron C, synapsing a motor neuron D. Neuron B firing at a high rate as a result of a proximal mate potentiates synapse S and immediately raises the firing rate of D , causing the organism to turn around and stay in the same area.
Figure 18
Figure 18. Histogram of mutual information values of virtual organisms with Non-Hebbian LTP synapses compared to randomly chosen synapses.
A. Histogram of I(D;W) values of 250 randomly chosen synapses with var(W)>0 of different virtual organisms randomly chosen from the behavior- based evolutionary session. B. Histogram of I(D;W) values of 250 randomly chosen Non-Hebbian LTP pre- synaptic synapses of different virtual organisms randomly chosen from the behavior- based evolutionary session. I(D;W) is the mutual information between the synapse state and the distance of the closest mate. The Non-Hebbian LTP pre- synaptic synapses contained more information about the closest mate (T-test P<10−16). For more information about the way I(D;W) was calculated see the Materials and Methods sections.

Similar articles

Cited by

References

    1. Montana D, Lawrance D. Training Feed Forward networks using genetic algorithms. 1989. Proc. of Int. Joint Conf. on Artificial Intelligence; Detroit, Michigan, USA.
    1. Harp S, Samad T, Guha A. Toward the genetic synthesis of neural networks. In: S DJ, editor. Third Intl. Conf. on Genetic Algorithms; Virginia, USA: Morgan Kaufmann; 1989. pp. 360–369.
    1. Rust AG. Developmental self Organization in Artificial Neural Networks. 1998. Ph.D: University of Hertfordshire.
    1. Rust AG, Adams R, Bolouri H. Evolutionary neural topiary: Growing and sculpting artificial neurons to order. In: B MA, M JS, P NH, R S, editors. Artificial Life VII: The 7th International Conference. Cambridge, MA: MIT Press; 2000.
    1. Kitano H. Designing neural networks using genetic algorithms with graph generation system. Complex Systems. 1990;4:461–476.

Publication types