. 2009 Jun;467(6):1568-76.
doi: 10.1007/s11999-008-0610-z. Epub 2008 Nov 11.

Trends in bilateral total knee arthroplasties: 153,259 discharges between 1990 and 2004

Affiliations

Trends in bilateral total knee arthroplasties: 153,259 discharges between 1990 and 2004

Stavros G Memtsoudis et al. Clin Orthop Relat Res. 2009 Jun.

Abstract

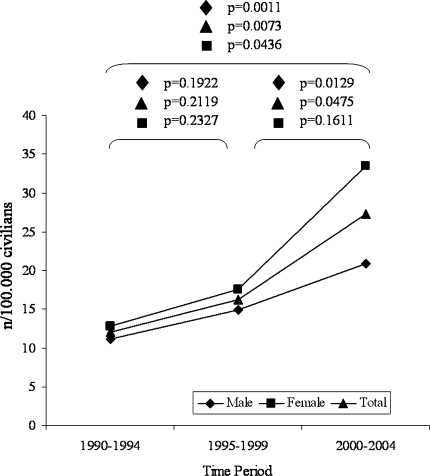
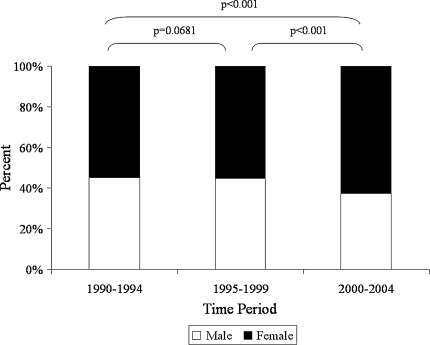
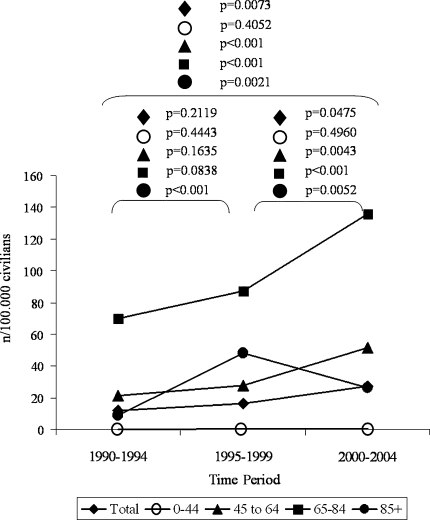
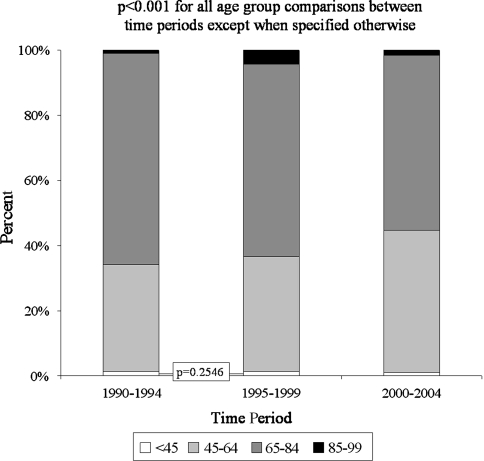
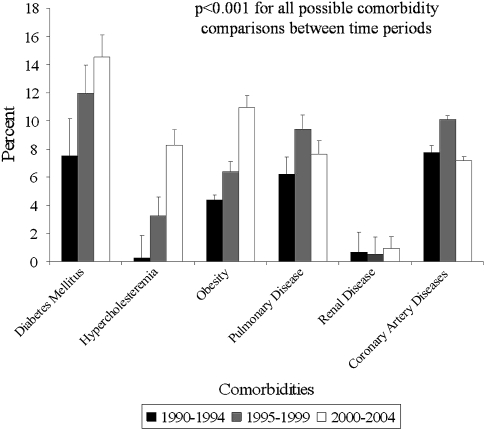
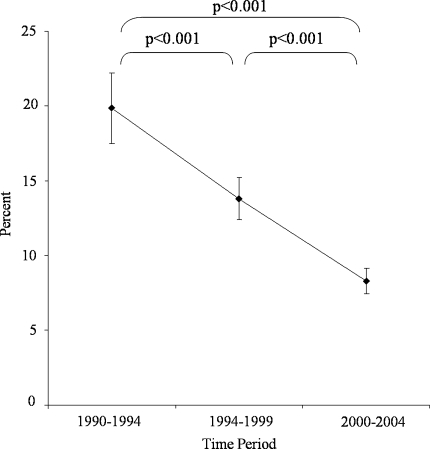
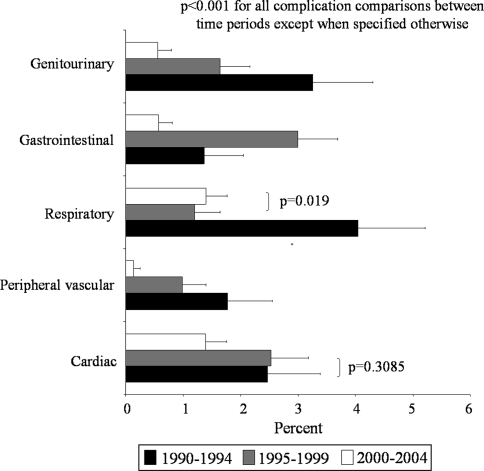
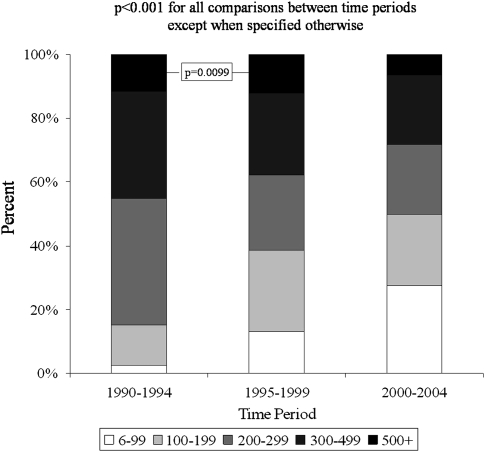
Information regarding national trends in bilateral TKAs is needed for a rational allocation of resources, policy making, and research. Therefore, we analyzed data from the National Hospital Discharge Survey to elucidate temporal changes in the demographics, comorbidity profiles, hospital stay, and in-hospital complications of patients undergoing bilateral TKAs in the United States. We created three 5-year periods: 1990-1994, 1995-1999, 2000-2004. Procedure, healthcare system, and patient-related variables were analyzed for an estimated 153,259 discharges. Use of bilateral TKAs more than doubled for the entire civilian population and almost tripled among the female population, with the steepest increase seen during the last two study periods. A decline of nearly 50% in the use of bilateral TKAs in patients 85 years and older was seen between the second and third study periods. The prevalence of coronary artery disease and pulmonary disease increased from the first to the second study periods but decreased from the second to the third. The changes in the variables studied may reflect a recently acquired reluctance to perform bilateral TKAs in elderly patients with cardiopulmonary comorbidities. Additional studies are necessary to identify other causal relationships and define the impact of these changes on various aspects of the healthcare system.

Level of evidence: Level II, prognostic study. See the Guidelines for Authors for a complete description of levels of evidence.


Figures

Fig. 1
Fig. 1
The figure shows the temporal changes in gender-adjusted and unadjusted use of BTKAs by time. The use of BTKAs more than doubled for the entire population and almost tripled among the female population, with the steepest increase seen during the last two times. The values are expressed as number per 100,000 US civilians per time.
Fig. 2
Fig. 2
The figure shows the gender distribution of BTKAs with time. The proportion of female patients undergoing BTKAs increased (p < 0.001) from 54.62% in 1990–1994 to 62.56% in 2000–2004.
Fig. 3
Fig. 3
The figure shows the changes in age group-adjusted and unadjusted use of BTKAs by time. All age groups experienced an increase in use of BTKAs throughout the study period, except the group 85 years and older. Between the second and third periods of study, a decline of nearly 50% was seen. The values are expressed as number per 100,000 US civilians per time.
Fig. 4
Fig. 4
The figure shows the age group distribution of BTKAs with time. There was an increased (p < 0.001) proportion of patients between the ages of 45 and 64 years receiving BTKAs (32.83% in 1990–1994; 43.62% in 2000–2004). For every age group, a difference was found between times (p < 0.001), except for < 45 years group between 1990–1994 and 1995–1999 (p = 0.2546).
Fig. 5
Fig. 5
The figure shows the prevalence of comorbidities among patients undergoing BTKAs with time. Error bars represent standard errors. There was an increase (p < 0.001) in the prevalence of diabetes mellitus, hypercholesterolemia, obesity, and renal disease with time. The prevalence of coronary artery disease and pulmonary disease increased (p < 0.001) from the first to the second periods but decreased (p < 0.001) from the second to the third periods of study. Hypertension data are not shown in the graph.
Fig. 6
Fig. 6
There was a decrease (p < 0.001) in the procedure-related complications (ICD-9-CM 996–999) captured during hospitalization following BTKAs with time. Error bars represent standard errors.
Fig. 7
Fig. 7
There was a decrease in organ-specific procedure-related complications associated with BTKAs with time (p < 0.001 between all periods for all organ systems, except pulmonary complications between 1995–1999 and 2000–2004 [p = 0.0019] and cardiac complications between 1990–1994 and 1995–1999 [p = 0.3085]). Error bars represent standard errors.
Fig. 8
Fig. 8
The figure shows distribution of BTKAs by hospital size (number of beds) with time. There was an increasing number of BTKAs being performed in smaller hospitals (p < 0.001 between all periods for all bed size groups, except the 500 + category between 1990–1994 and 1995–1999 [p = 0.0099]).
Fig. 9
Fig. 9
The figure shows distribution of BTKAs by US region with time. The majority of BTKAs were performed in the Northeastern and Midwestern regions of the United States; however, an increasing proportion was noted in the southern and western regions most recently. The differences between US region groups across periods of interest were significant (p < 0.001 between all times for all US region groups, except the Southwestern region category between 1990–1994 and 1995–1999 [p = 0.1335]).

Similar articles

Cited by

References

    1. {'text': '', 'ref_index': 1, 'ids': [{'type': 'DOI', 'value': '10.2106/JBJS.E.01323', 'is_inner': False, 'url': 'https://doi.org/10.2106/jbjs.e.01323'}, {'type': 'PubMed', 'value': '17015590', 'is_inner': True, 'url': 'https://pubmed.ncbi.nlm.nih.gov/17015590/'}]}
    2. Barrett J, Baron JA, Losina E, Wright J, Mahomed NN, Katz JN. Bilateral total knee replacement: staging and pulmonary embolism. J Bone Joint Surg Am. 2006;88:2146–2151. - PubMed
    1. {'text': '', 'ref_index': 1, 'ids': [{'type': 'PubMed', 'value': '11940616', 'is_inner': True, 'url': 'https://pubmed.ncbi.nlm.nih.gov/11940616/'}]}
    2. Bhattacharyya T, Iorio R, Healy WL. Rate of and risk factors for acute inpatient mortality after orthopaedic surgery. J Bone Joint Surg Am. 2002;84:562–572. - PubMed
    1. Design and Operation of the National Hospital Discharge Survey: 1988 Redesign. Atlanta, GA: US Department of Health and Human Services, Centers for Disease Control and Prevention, National Center for Health Statistics; 1988.
    1. {'text': '', 'ref_index': 1, 'ids': [{'type': 'DOI', 'value': '10.1016/S0003-9993(99)90120-X', 'is_inner': False, 'url': 'https://doi.org/10.1016/s0003-9993(99)90120-x'}, {'type': 'PubMed', 'value': '10025496', 'is_inner': True, 'url': 'https://pubmed.ncbi.nlm.nih.gov/10025496/'}]}
    2. Forrest GP, Roque JM, Dawodu ST. Decreasing length of stay after total joint arthroplasty: effect on referrals to rehabilitation units. Arch Phys Med Rehabil. 1999;80:192–194. - PubMed
    1. {'text': '', 'ref_index': 1, 'ids': [{'type': 'PubMed', 'value': '10166754', 'is_inner': True, 'url': 'https://pubmed.ncbi.nlm.nih.gov/10166754/'}]}
    2. Graves EJ. 1993 summary: National Hospital Discharge Survey. Adv Data. 1995;264:1–11. - PubMed