. 2008 Dec;40(6):577-85.
doi: 10.1007/s10863-008-9187-1. Epub 2008 Nov 11.

The yeast mitochondrial citrate transport protein: identification of the Lysine residues responsible for inhibition mediated by Pyridoxal 5'-phosphate

Affiliations

The yeast mitochondrial citrate transport protein: identification of the Lysine residues responsible for inhibition mediated by Pyridoxal 5'-phosphate

Sreevidya Remani et al. J Bioenerg Biomembr. 2008 Dec.

Abstract

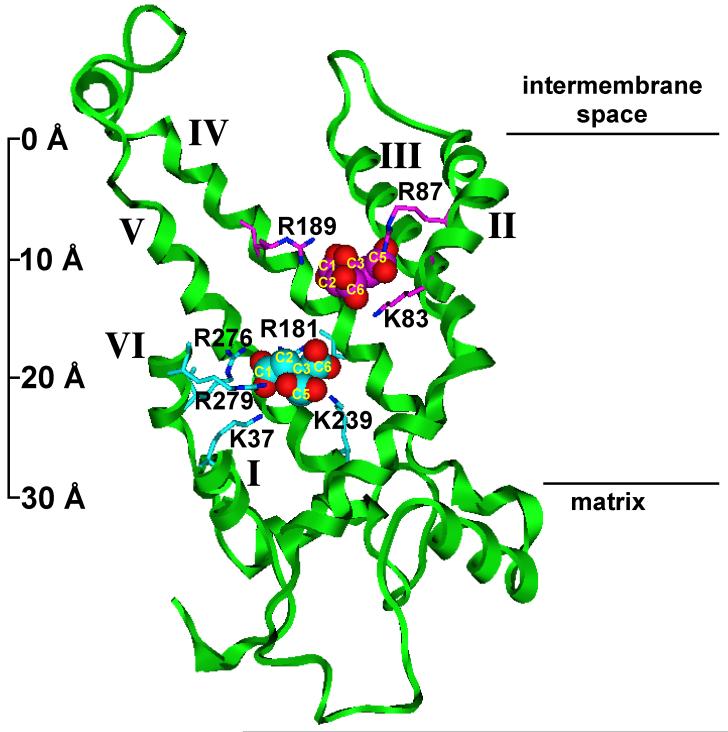
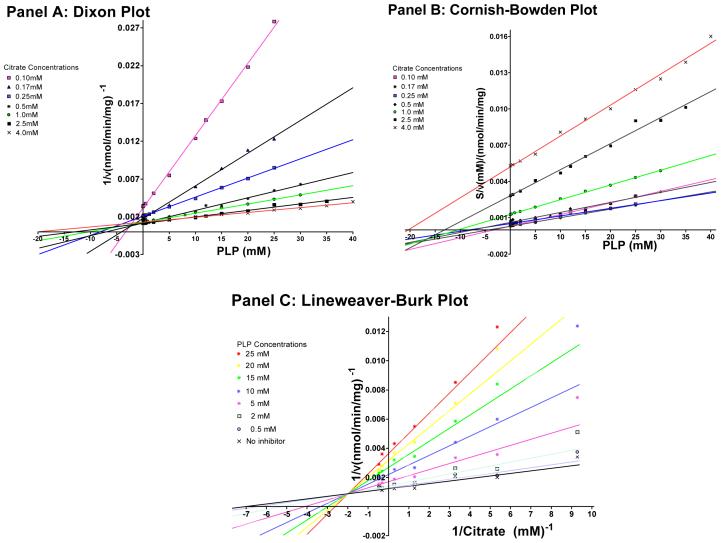
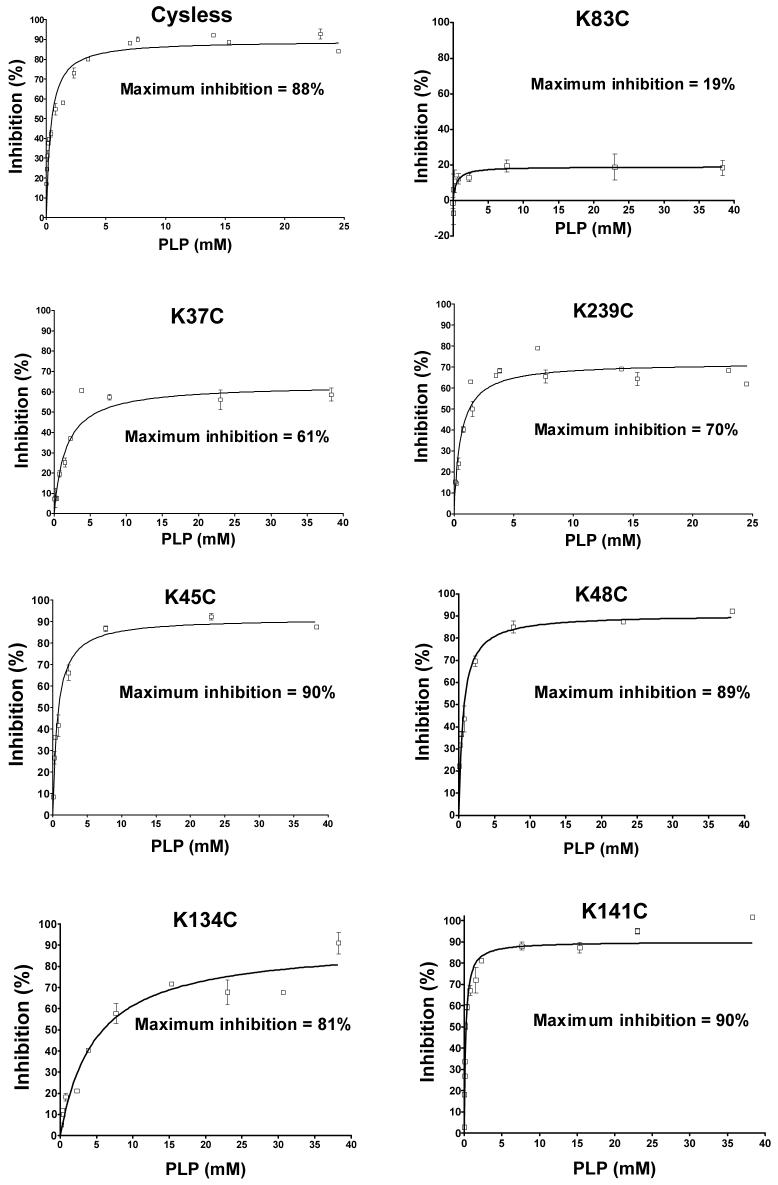
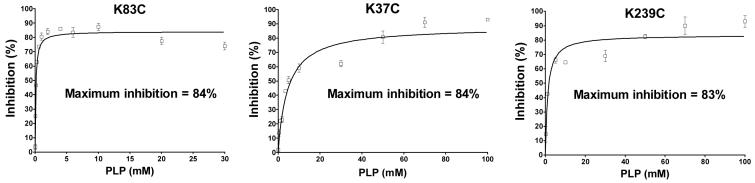
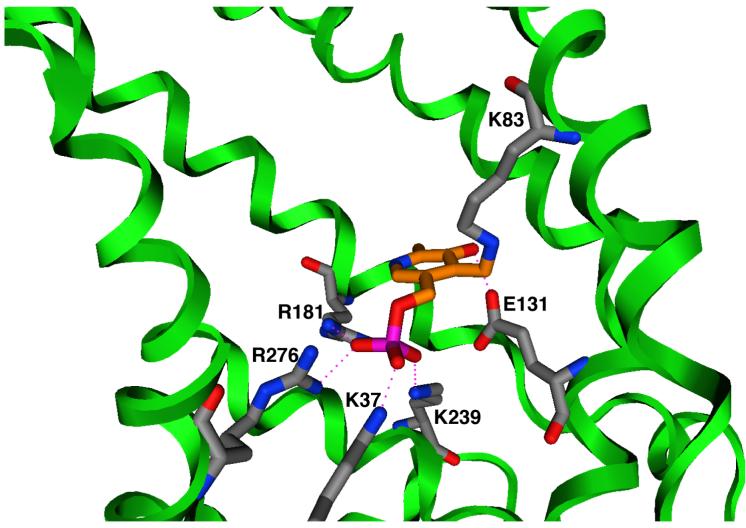
The present investigation identifies the molecular basis for the well-documented inhibition of the mitochondrial inner membrane citrate transport protein (CTP) function by the lysine-selective reagent pyridoxal 5'-phosphate. Kinetic analysis indicates that PLP is a linear mixed inhibitor of the Cys-less CTP, with a predominantly competitive component. We have previously concluded that the CTP contains at least two substrate binding sites which are located at increasing depths within the substrate translocation pathway and which contain key lysine residues. In the present investigation, the roles of Lys-83 in substrate binding site one, Lys-37 and Lys-239 in substrate binding site two, and four other off-pathway lysines in conferring PLP-inhibition of transport was determined by functional characterization of seven lysine to cysteine substitution mutants. We observed that replacement of Lys-83 with cysteine resulted in a 78% loss of the PLP-mediated inhibition of CTP function. In contrast, replacement of either Lys-37 or Lys-239 with cysteine caused a modest reduction in the inhibition caused by PLP (i.e., 31% and 20% loss of inhibition, respectively). Interestingly, these losses of PLP-mediated inhibition could be rescued by covalent modification of each cysteine with MTSEA, a reagent that adds a lysine-like moiety (i.e. SCH(2)CH(2)NH(3) (+)) to the cysteine sulfhydryl group. Importantly, the replacement of non-binding site lysines (i.e., Lys-45, Lys-48, Lys-134, Lys-141) with cysteine resulted in little change in the PLP inhibition. Based upon these results, we conducted docking calculations with the CTP structural model leading to the development of a physical binding model for PLP. In combination, our data support the conclusion that PLP exerts its main inhibitory effect by binding to residues located within the two substrate binding sites of the CTP, with Lys-83 being the primary determinant of the total PLP effect since the replacement of this single lysine abolishes nearly all of the observed inhibition by PLP.


Figures

Figure 1
Figure 1. Two citrate binding sites within the CTP transport pathway viewed in the plane of the membrane bilayer
Two citrate binding sites, viewed in the plane of the membrane bilayer (i.e., a side view) are presented. The backbone of the CTP is represented as a green ribbon. Important side chains are shown as stick structures, and citrate molecules are shown as space filling structures. Citrate oxygens are red. In site one, the citrate carbons and the directly interacting side chains are magenta; in site two, the citrate carbons and the directly interacting side chains are cyan. The distance between the two sites (measuring at the central carbon atoms of the two citrates) is 9.2 Å. Portions of TMDs I, II, and VI have been cut away for clarity. Black horizontal lines at right indicate the approximate boundaries of the bilayer and the atomic ruler at the left indicates approximate dimensions. Reproduced from Ma et al. (2007) with permission from the J. Biol. Chem.
Figure 2
Figure 2. Determination of the kinetic type of PLP-mediated inhibition of the Cys-less CTP
The rate of BTC-sensitive [14C]citrate/citrate exchange was determined in the presence of varying concentrations (i.e., 0 - 40 mM) of PLP. These inhibition plots were determined at multiple citrate concentrations ranging from 0.1 mM - 4.0 mM. Best fit lines in Panels A and B were constructed according to linear regression analysis by the methods of least squares. In Panel C the lines were derived from a Global Fit to Equation 1 at each PLP concentration. Other conditions were as described under “Experimental Procedures”.
Figure 3
Figure 3. Inhibition of yeast mitochondrial CTP variants by PLP
The Cys-less CTP, as well as single lysine to cysteine substitution mutants were incubated with varying concentrations of PLP for 10 min followed by incubation with sodium borohydride (1.0-1.5-fold excess relative to PLP concentration) for 10 min. BTC-sensitive citrate transport was then measured at 21°C. Data represent means ± S.E. of incubations repeated 2-6 times. Percent maximum inhibition was obtained from the best fit curve generated via non-linear regression analysis using Equation 2 in “Experimental Procedures”. Other conditions were as described under “Experimental Procedures”.
Figure 4
Figure 4. Effect of MTSEA labeling of binding site cysteine substitution mutants on PLP-mediated inhibition of CTP function
Proteoliposomes were preincubated with 0.05-0.06 mM MTSEA for 10 min prior to the addition of PLP. Sodium borohydride was excluded from these incubations in order to avoid reduction of the Cys-MTS reagent disulfide bond. Data represent means ± S.E. of incubations repeated 2-3 times. Other conditions were as described under “Experimental Procedures”.
Figure 5
Figure 5. Docking of PLP within the CTP substrate binding sites
Pyridoxal 5′-phosphate is covalently bonded to the side-chain of Lys-83. The phosphate forms ionic hydrogen bonds with Lys-37, Lys-239, Arg-181, and Arg-276. The hydroxyl group of PLP forms an ionic hydrogen bond with Glu-131. The protein backbone is depicted as a green ribbon; blue = nitrogen, red = oxygen, magenta = phosphorus, gray = protein carbon atoms, orange = PLP carbon atoms. Hydrogen bonds are shown as dotted lines.

Similar articles

Cited by

References

    1. Brunengraber H, Lowenstein JM. FEBS Lett. 1973;36:130–132. - PubMed
    1. Conover TE. Trends Biochem. Sci. 1987;12:88–89.
    1. Cornish-Bowden A. Biochem. J. 1974;137:143–144. - PMC - PubMed
    1. Cortes A, Cascante M, Cardenas ML, Cornish-Bowden A. Biochem. J. 2001;357:263–268. - PMC - PubMed
    1. Dierks T, Stappen R, Salentin A, Kramer R. Biochim. Biophys. Acta. 1992;1103:13–24. - PubMed

Publication types