On-line monitoring of infected Sf-9 insect cell cultures by scanning permittivity measurements and comparison with off-line biovolume measurements
- PMID: 19003001
- PMCID: PMC2104552
- DOI: 10.1007/s10616-007-9093-0
On-line monitoring of infected Sf-9 insect cell cultures by scanning permittivity measurements and comparison with off-line biovolume measurements
Abstract
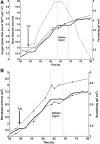
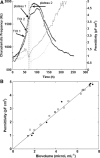
Two infected Sf-9 cell cultures were monitored on-line by multi-frequency permittivity measurements using the Fogale BIOMASS SYSTEM((R)) and by applying different off-line methods (CASY((R))1, Vi-CELLtrade mark, packed cell volume) to measure the biovolume and the mean diameter of the cell population. During the growth phase and the early infection phase the measured permittivity at the working frequency correlated well with the different off-line methods for the biovolume. We found a value of 0.67 pF cm(-1) permittivity per unit of total biovolume (CASY) (muL mL(-1)). After the maximum value in the permittivity was reached, i.e. when the viability of the cultures decreased significantly, we observed different time courses for the biovolume depending on the applied method. The differences were compared and could be explained by the underlying measurement principles. Furthermore, the characteristic frequency (f(C)) was calculated from the on-line scanning permittivity measurements. The f(C) may provide an indication of changes in cell diameter and membrane properties especially after infection and could also be an indicator for the onset of the virus production phase. The changes in f(C) were qualitatively explained by the underlying equation that is correlating f(C) and the properties of the cell population (cell diameter, intracellular conductivity and capacitance per membrane area).
Figures


Similar articles
-
Multifrequency permittivity measurements enable on-line monitoring of changes in intracellular conductivity due to nutrient limitations during batch cultivations of CHO cells.Biotechnol Prog. 2010 Jan-Feb;26(1):272-83. doi: 10.1002/btpr.347. Biotechnol Prog. 2010. PMID: 19899122
-
On-line monitoring of physiological parameters of insect cell cultures during the growth and infection process.Biotechnol Prog. 2000 Sep-Oct;16(5):803-8. doi: 10.1021/bp000092w. Biotechnol Prog. 2000. PMID: 11027174
-
On-line monitoring of responses to nutrient feed additions by multi-frequency permittivity measurements in fed-batch cultivations of CHO cells.Cytotechnology. 2010 Apr;62(2):121-32. doi: 10.1007/s10616-010-9267-z. Epub 2010 Apr 21. Cytotechnology. 2010. PMID: 20407823 Free PMC article.
-
Critical phases of viral production processes monitored by capacitance.J Biotechnol. 2017 Jan 20;242:19-29. doi: 10.1016/j.jbiotec.2016.11.010. Epub 2016 Nov 17. J Biotechnol. 2017. PMID: 27867077
-
Quantitative modeling of viable cell density, cell size, intracellular conductivity, and membrane capacitance in batch and fed-batch CHO processes using dielectric spectroscopy.Biotechnol Prog. 2010 Jul-Aug;26(4):1187-99. doi: 10.1002/btpr.425. Biotechnol Prog. 2010. PMID: 20730773
Cited by
-
Introducing process analytical technology (PAT) in filamentous cultivation process development: comparison of advanced online sensors for biomass measurement.J Ind Microbiol Biotechnol. 2011 Oct;38(10):1679-90. doi: 10.1007/s10295-011-0957-0. Epub 2011 Apr 2. J Ind Microbiol Biotechnol. 2011. PMID: 21461747
-
Dielectric Spectroscopy and Optical Density Measurement for the Online Monitoring and Control of Recombinant Protein Production in Stably Transformed Drosophila melanogaster S2 Cells.Sensors (Basel). 2018 Mar 18;18(3):900. doi: 10.3390/s18030900. Sensors (Basel). 2018. PMID: 29562633 Free PMC article.
-
Evaluation of an online biomass probe to monitor cell growth and cell death.BMC Proc. 2011 Nov 22;5 Suppl 8(Suppl 8):P16. doi: 10.1186/1753-6561-5-S8-P16. eCollection 2011. BMC Proc. 2011. PMID: 22373522 Free PMC article. No abstract available.
-
Application of dielectric spectroscopy to unravel the physiological state of microorganisms: current state, prospects and limits.Appl Microbiol Biotechnol. 2020 Jul;104(14):6101-6113. doi: 10.1007/s00253-020-10677-x. Epub 2020 May 21. Appl Microbiol Biotechnol. 2020. PMID: 32440707 Review.
-
Universal Capacitance Model for Real-Time Biomass in Cell Culture.Sensors (Basel). 2015 Sep 2;15(9):22128-50. doi: 10.3390/s150922128. Sensors (Basel). 2015. PMID: 26364635 Free PMC article.
References
-
- Ansorge S, Esteban G, Ghommidh C, Schmid G (2007) Monitoring nutrient limitations by online capactitance measurements in batch and fed-batch CHO fermentations. In: Smith R (ed) Conference Proceedings to the 19th ESACT Meeting: Cell Technology for Cell Products. Springer, Dordrecht/NL, pp 723–726
-
- {'text': '', 'ref_index': 1, 'ids': [{'type': 'DOI', 'value': '10.1002/bit.10809', 'is_inner': False, 'url': 'https://doi.org/10.1002/bit.10809'}, {'type': 'PubMed', 'value': '14574694', 'is_inner': True, 'url': 'https://pubmed.ncbi.nlm.nih.gov/14574694/'}]}
- Cannizzaro C, Gugerli R, Marison I, von Stockar U (2003) On-line biomass monitoring of CHO perfusion culture with scanning dielectric spectroscopy. Biotechnol Bioeng 84:597–610 - PubMed
-
- None
- Chico E, Jäger V (1998) Measurements of changes in cell size distribution to monitor Baculovirus infection of insect cells. In: Merten OW, Perrin P, Griffiths B (eds) New developments and new applications in animal cell technology. Kluwer Academic Publishers, Dordrecht, 329–331
-
- {'text': '', 'ref_index': 1, 'ids': [{'type': 'DOI', 'value': '10.1016/0003-2697(89)90191-7', 'is_inner': False, 'url': 'https://doi.org/10.1016/0003-2697(89)90191-7'}, {'type': 'PubMed', 'value': '2667390', 'is_inner': True, 'url': 'https://pubmed.ncbi.nlm.nih.gov/2667390/'}]}
- Cook JA, Mitchell JB (1989) Viability measurements in mammalian cell systems. Anal Biochem 179:1–7 - PubMed
-
- None
- Davey CL (1993) The biomass monitor source book. Department of Biological Sciences, University of Wales, Aberystwyth
LinkOut - more resources
Full Text Sources
Other Literature Sources

