. 2008 Jun;57(2):199-205.
doi: 10.1007/s10616-008-9156-x. Epub 2008 Jul 23.

Analysis of chicken primordial germ cells

Affiliations

Analysis of chicken primordial germ cells

Makoto Motono et al. Cytotechnology. 2008 Jun.

Abstract

Primordial germ cells (PGCs) are precursors of germline cells. Although avian PGCs have been used to produce transgenic birds, their characteristics largely remain unknown. In this study, we isolated PGCs from chicken embryos at various developmental stages and analyzed the gene expression. Using the expression of stage-specific embryonic antigen-1 (SSEA-1) as a marker of chicken PGCs, we purified PGCs from embryos by fluorescence-activated cell sorting after incubation for 2.5-8.5 days. The number of SSEA-1(+) cells was almost unchanged during days 2.5-8.5 of incubation in females but continuously increased in male. Expression of several genes, including Blimp1, SOX2, and CXCR4, was observed in SSEA-1(+) cells but not in SSEA-1(-) cells in both female and male embryos. Quantitative reverse-transcription PCR analysis revealed that the expression of CXCR4, a chemokine receptor essential for migration of PGCs from the bloodstream to the gonads, was reduced after the circulating PGC stage (day 2.5).


Figures
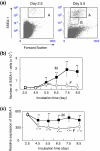
Fig. 1
Fig. 1
Flow cytometric analysis of chicken PGCs. (a) Green fluorescence (stained for SSEA-1) versus forward scatter plot of blood at day 2.5 (stages 13–16 (mixture of female and male embryos)) (left) and gonadal cells at day 5.5 (stage 28) (right). The letter A indicates the region for cell sorting; B indicates the region of smaller cells expressing a lower level of SSEA-1. (b) Cell number of SSEA-1+ cells in blood and gonads of males and females in region A (Fig. 1a). M, male; F, female. Data are expressed as mean value with standard deviation of three independent experiments (day 2.5) or of 5–7 embryos analyzed individually (day 4.5–8.5). * indicates statistical significance relative to male by Student’s t test (p < 0.05). ** indicates statistical significance relative to day 2.5 by Student’s t test (p < 0.05). (c) Expression levels of SSEA-1 were indicated as mean fluorescence intensity of the cells in region A (Fig. 1a). Data are expressed as mean value with standard deviation of 5–7 embryos analyzed individually except for day 2.5 (pooled blood samples were analyzed and the mean of three independent experiments is shown)
Fig. 2
Fig. 2
Expression of VASA by SSEA-1+ cells. (a) Both SSEA-1+ and SSEA-1 cells were sorted from embryos after various incubation times, and the expression of VASA was examined by RT-PCR. PGCs from blood (day 2.5) were analyzed as mixtures of cells from males and females. (b) Quantitative RT-PCR analysis of VASA in SSEA-1+ cells in region A of Fig. 1a. M, male; F, female. Data are expressed as mean value with standard deviation of three embryos analyzed individually except for day 2.5 (pooled blood samples were analyzed and the mean of three independent experiments is shown). ** indicates statistical significance relative to day 2.5 by Student’s t test (p < 0.05). Sex difference was not statistically significant by Student’s t test. (c) Immunostaining of sorted SSEA-1+ cells with anti-VASA antibody. Anti-SSEA-1 (left), anti-VASA (middle), and phase-contrast (right)
Fig. 3
Fig. 3
RT-PCR analysis of SSEA-1+ and SSEA-1 cells. (a) Expression of several genes was analyzed by RT-PCR. (b) Quantitative RT-PCR analysis of CXCR4 in SSEA-1+ cells. M, male; F, female. Data are expressed as mean value with standard deviation of three embryos analyzed individually except for day 2.5 (pooled blood samples were analyzed and the mean of three independent experiments is shown). ** indicates statistical significance relative to day 2.5 by Student’s t test (p < 0.05). Sex difference was not statistically significant by Student’s t test

Similar articles

Cited by

References

    1. {'text': '', 'ref_index': 1, 'ids': [{'type': 'DOI', 'value': '10.1038/ncb1413', 'is_inner': False, 'url': 'https://doi.org/10.1038/ncb1413'}, {'type': 'PubMed', 'value': '16699504', 'is_inner': True, 'url': 'https://pubmed.ncbi.nlm.nih.gov/16699504/'}]}
    2. Ancelin K, Lange UC, Hajkova P et al (2006) Blimp1 associates with Prmt5 and directs histone arginine methylation in mouse germ cells. Nat Cell Biol 8:623–630. doi:10.1038/ncb1413 - PubMed
    1. {'text': '', 'ref_index': 1, 'ids': [{'type': 'DOI', 'value': '10.1016/j.cell.2005.08.020', 'is_inner': False, 'url': 'https://doi.org/10.1016/j.cell.2005.08.020'}, {'type': 'PMC', 'value': 'PMC3006442', 'is_inner': False, 'url': 'https://pmc.ncbi.nlm.nih.gov/articles/PMC3006442/'}, {'type': 'PubMed', 'value': '16153702', 'is_inner': True, 'url': 'https://pubmed.ncbi.nlm.nih.gov/16153702/'}]}
    2. Boyer LA, Lee TI, Cole MF et al (2005) Core transcriptional regulatory circuitry in human embryonic stem cells. Cell 122:947–956. doi:10.1016/j.cell.2005.08.020 - PMC - PubMed
    1. {'text': '', 'ref_index': 1, 'ids': [{'type': 'PubMed', 'value': '7818175', 'is_inner': True, 'url': 'https://pubmed.ncbi.nlm.nih.gov/7818175/'}]}
    2. Clinton M (1994) A rapid protocol for sexing chick embryos (Gallus g. domesticus). Anim Genet 25:361–362 - PubMed
    1. None
    2. Etches RJ (1995) Physiology of reproduction: the female. In: Hunton P (ed) Poultry production. Elsevier, Amsterdam, pp 221–241
    1. {'text': '', 'ref_index': 1, 'ids': [{'type': 'DOI', 'value': '10.1016/0012-1606(76)90178-0', 'is_inner': False, 'url': 'https://doi.org/10.1016/0012-1606(76)90178-0'}, {'type': 'PubMed', 'value': '944662', 'is_inner': True, 'url': 'https://pubmed.ncbi.nlm.nih.gov/944662/'}]}
    2. Eyal-Giladi H, Kochav S (1976) From cleavage to primitive streak formation: a complementary normal table and a new look at the first stages of the development of the chick. I. General morphology. Dev Biol 49:321–337. doi:10.1016/0012-1606(76)90178-0 - PubMed