

Simulated power spectral density (PSD) of background electrocorticogram (ECoG)
- PMID: 19003455
- PMCID: PMC2645494
- DOI: 10.1007/s11571-008-9064-y
Simulated power spectral density (PSD) of background electrocorticogram (ECoG)
Abstract
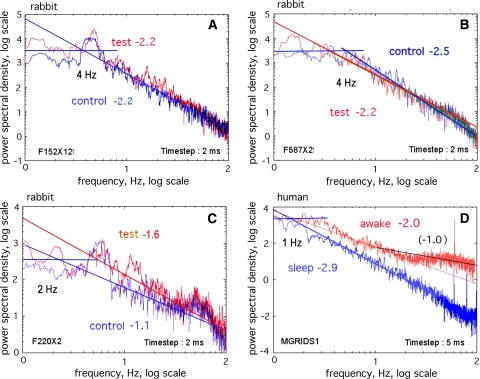
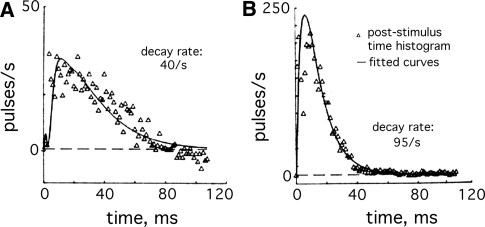
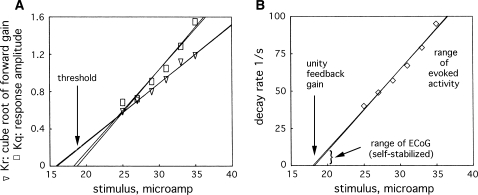
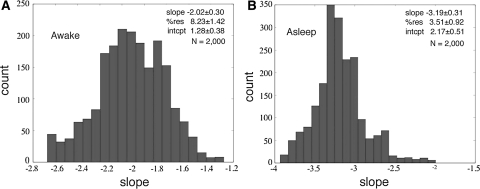
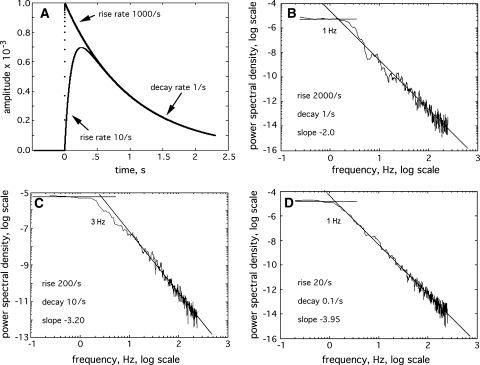
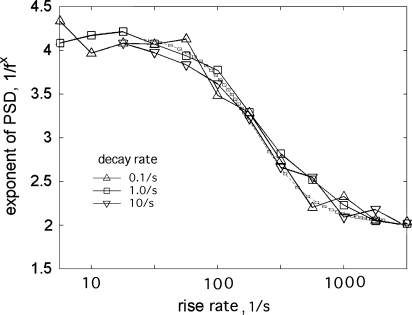
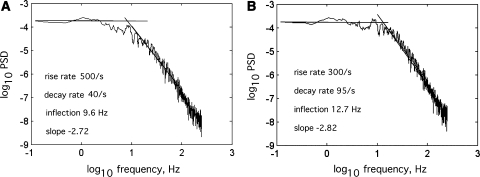
The ECoG background activity of cerebral cortex in states of rest and slow wave sleep resembles broadband noise. The power spectral density (PSD) then may often conform to a power-law distribution: a straight line in coordinates of log power vs. log frequency. The exponent, x, of the distribution, 1/f(x), ranges between 2 and 4. These findings are explained with a model of the neural source of the background activity in mutual excitation among pyramidal cells. The dendritic response of a population of interactive excitatory neurons to an impulse input is a rapid exponential rise and a slow exponential decay, which can be fitted with the sum of two exponential terms. When that function is convolved as the kernel with pulses from a Poisson process and summed, the resulting "brown" or "black noise conforms to the ECoG time series and the PSD in rest and sleep. The PSD slope is dependent on the rate of rise. The variation in the observed slope is attributed to variation in the level of the background activity that is homeostatically regulated by the refractory periods of the excitatory neurons. Departures in behavior from rest and sleep to action are accompanied by local peaks in the PSD, which manifest emergent nonrandom structure in the ECoG, and which prevent reliable estimation of the 1/f(x) exponents in active states. We conclude that the resting ECoG truly is low-dimensional noise, and that the resting state is an optimal starting point for defining and measuring both artifactual and physiological structures emergent in the activated ECoG.
Figures
References
-
- None
- Abeles M (1991) Corticonics: neural circuits of the cerebral cortex. Cambridge UP, New York
-
- {'text': '', 'ref_index': 1, 'ids': [{'type': 'PubMed', 'value': '8836241', 'is_inner': True, 'url': 'https://pubmed.ncbi.nlm.nih.gov/8836241/'}]}
- Barrie JM, Freeman WJ, Lenhart M (1996) Modulation by discriminative training of spatial patterns of gamma EEG amplitude and phase in neocortex of rabbits. J Neurophysiol 76:520–539 - PubMed
-
- {'text': '', 'ref_index': 1, 'ids': [{'type': 'DOI', 'value': '10.1016/S0074-7742(08)60333-5', 'is_inner': False, 'url': 'https://doi.org/10.1016/s0074-7742(08)60333-5'}, {'type': 'PubMed', 'value': '4949975', 'is_inner': True, 'url': 'https://pubmed.ncbi.nlm.nih.gov/4949975/'}]}
- Elul R (1972) The genesis of the EEG. Int Rev Neurobiol 15:227–272. doi:10.1016/S0074-7742(08)60333-5 - PubMed
-
- {'text': '', 'ref_index': 1, 'ids': [{'type': 'DOI', 'value': '10.1109/TBME.1974.324403', 'is_inner': False, 'url': 'https://doi.org/10.1109/tbme.1974.324403'}, {'type': 'PubMed', 'value': '4376800', 'is_inner': True, 'url': 'https://pubmed.ncbi.nlm.nih.gov/4376800/'}]}
- Freeman WJ (1974) A model for mutual excitation in a neuron population in olfactory bulb. Trans IEEE Biomed Eng 21:350–358. doi:10.1109/TBME.1974.324403 - PubMed
-
- Freeman WJ (1975) Mass action in the nervous system. Academic Press, New York. © 2004: http://sulcus.berkeley.edu/MANSWWW/MANSWWW.html
