. 2007 Dec;1(4):305-16.
doi: 10.1007/s11571-007-9026-9. Epub 2007 Oct 12.

Spatial clustering property and its self-similarity in membrane potentials of hippocampal CA1 pyramidal neurons for a spatio-temporal input sequence

Affiliations

Spatial clustering property and its self-similarity in membrane potentials of hippocampal CA1 pyramidal neurons for a spatio-temporal input sequence

Yasuhiro Fukushima et al. Cogn Neurodyn. 2007 Dec.

Abstract

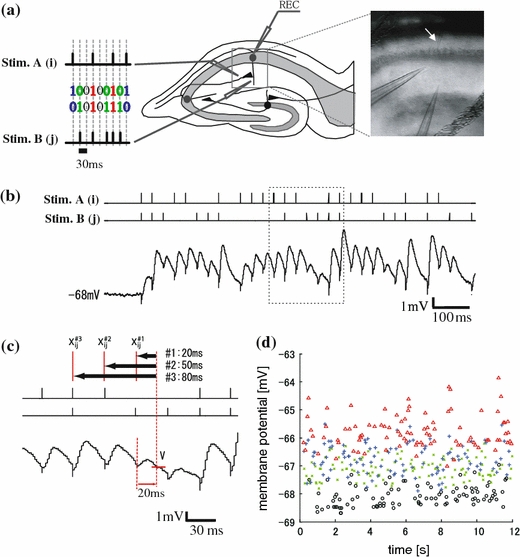
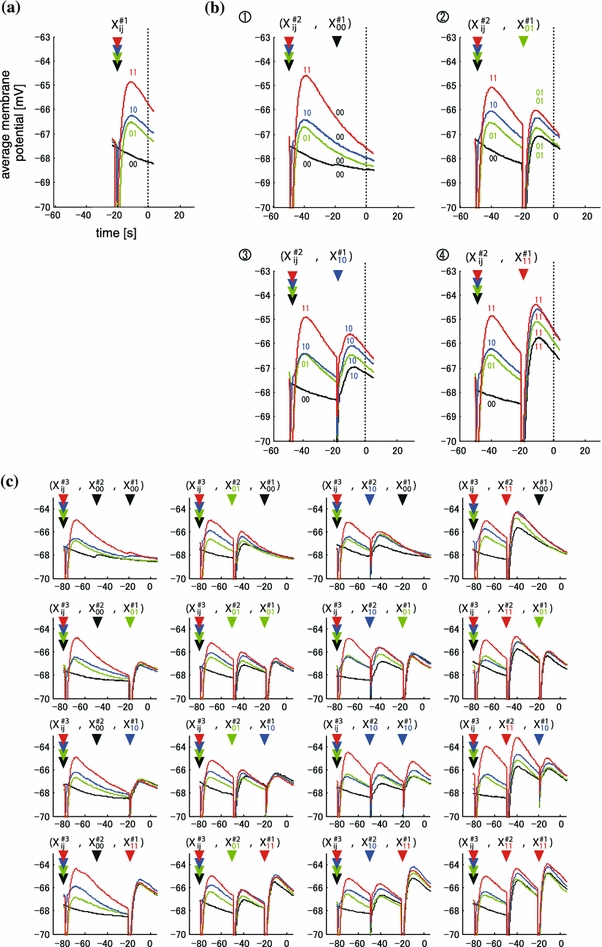
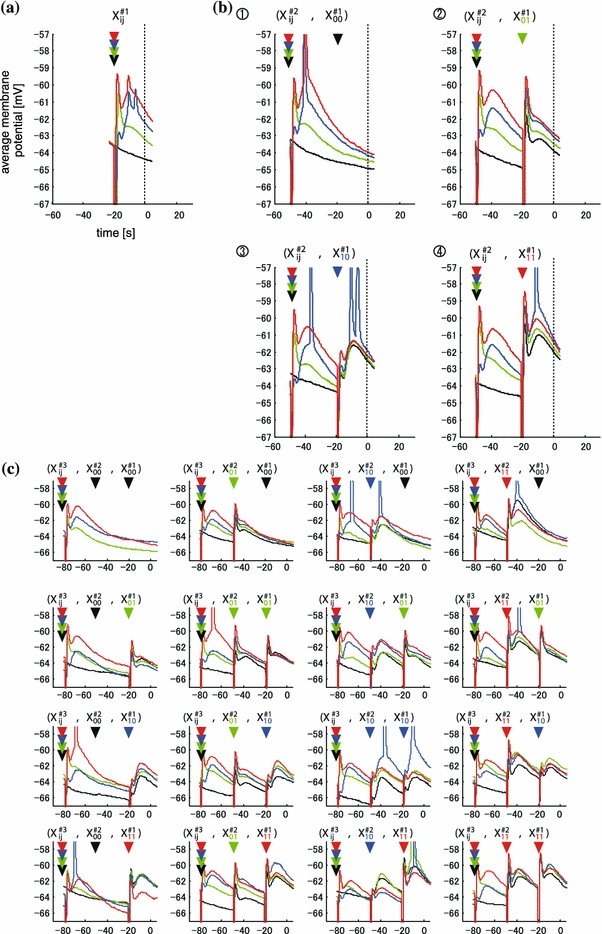
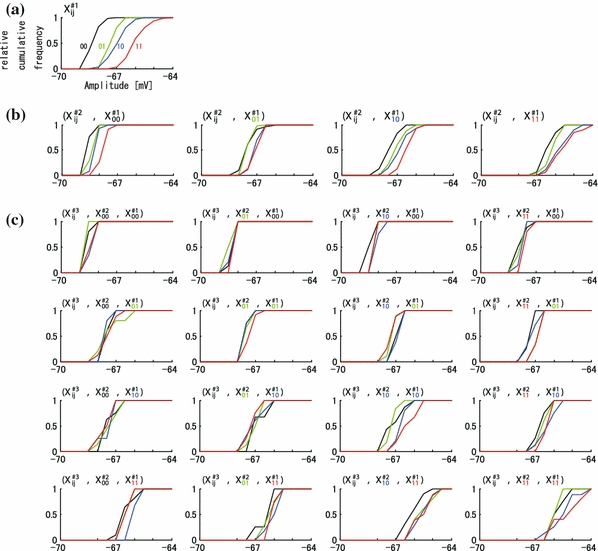
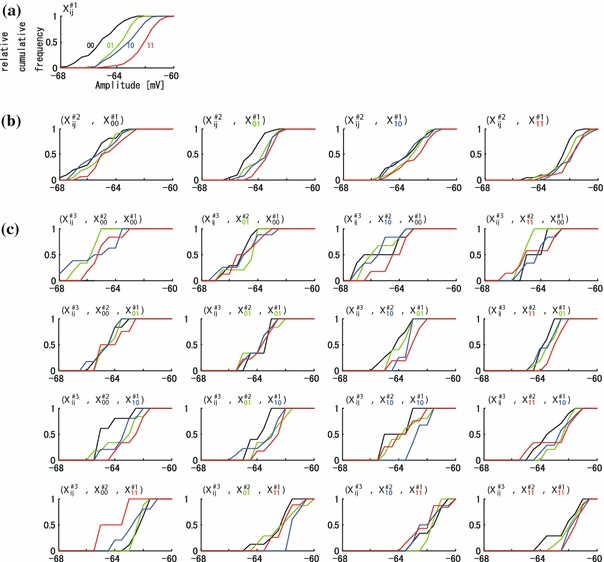
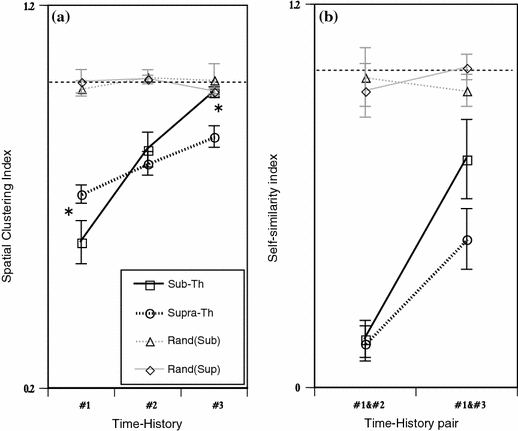
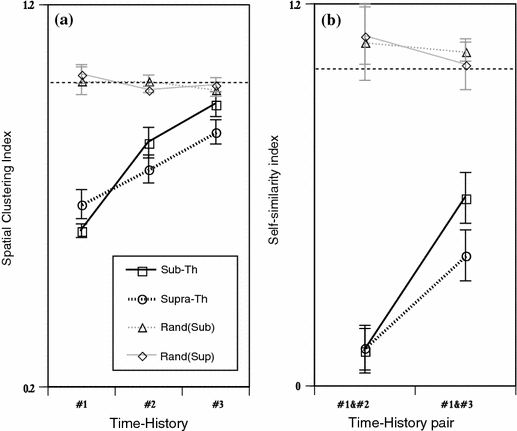
To clarify how the information of spatiotemporal sequence of the hippocampal CA3 affects the postsynaptic membrane potentials of single pyramidal cells in the hippocampal CA1, the spatio-temporal stimuli was delivered to Schaffer collaterals of the CA3 through a pair of electrodes and the post-synaptic membrane potentials were recorded using the patch-clamp recording method. The input-output relations were sequentially analyzed by applying two measures; "spatial clustering" and its "self-similarity" index. The membrane potentials were hierarchically clustered in a self-similar manner to the input sequences. The property was significantly observed at two and three time-history steps. In addition, the properties were maintained under two different stimulus conditions, weak and strong current stimulation. The experimental results are discussed in relation to theoretical results of Cantor coding, reported by Tsuda (Behav Brain Sci 24(5):793-847, 2001) and Tsuda and Kuroda (Jpn J Indust Appl Math 18:249-258, 2001; Cortical dynamics, pp 129-139, Springer-Verlag, 2004).


Figures

Fig. 1
Fig. 1
Experimental procedure and sample traces. (a) Schematic diagram (left) and IR-DIC image of hippocampal slices (right). Two independent extracellular electrodes were set onto the Schaffer collaterals in hippocampal CA1 areas. There were four input spatial patterns of electrical stimulation: electrical stimulation through both electrodes (“11” (red)), either electrode (“10” (blue) and “01” (green)), and neither electrode (“00” (black)). A random-ordered successive input spatial pattern appears sequentially in 30 ms intervals. The right image indicates IR-DIC image of the hippocampal CA1 areas. The white arrow indicates the recording electrode. The lower two electrodes are stimulation electrodes. (b) Sample traces of membrane potentials recorded from the soma of pyramidal neurons in rat hippocampal CA1 area. The upper two traces indicate the timing of electrical stimulation and the lower trace indicates membrane potentials recorded from neurons. The temporal timing of these traces was adjusted. (c) Schematic diagrams of the representative membrane potential (“amplitude”) and the stimulus patterns in the sequences. Three traces were corresponded to the timing of the rectangle area in (b). Left red vertical dotted line indicates one example of the timing of stimulation. Right dotted vertical line indicates the timing of 20 ms after pattern stimulation. The cross point of right dotted vertical line and red horizontal solid line indicates the representative value of the responses, “amplitude”. The “amplitudes” were classified by the pattern one time-history step (“X#1ij”), by the pattern two step before the sequence (“X#2ij”) and by the pattern three steps before the sequences (“X#3ij”). (d) Stable responses of the amplitudes classified into the four input spatial pattern groups for 12 s. The X-axis indicates recorded-timing (s) during a 12-s sequence of electrical stimulation. The Y-axis indicates amplitude (mV) at the timing of crossing line in (c). The color of plots indicate input spatial pattern; red, blue, green, and black traces indicate membrane potentials induced by the "11", "10", "01", and "00" type of electrical stimulation, respectively
Fig. 2
Fig. 2
Example of time-course of average amplitude of the responses in sub-threshold group. (a) Time course of averaged amplitudes in the four groups, which is classified by the pattern one time- history step. The color of traces indicate spatial stimulation pattern by the 1 time-history step; Red, blue, green, and black traces indicate membrane potentials induced by the spatial pattern of “11”, “10”, “01”, and “00”, respectively. Input spatial pattern was applied at the timing of arrowheads of four colors (X#1ij). Vertical dotted line indicates the timing of represented value of amplitude. The X- and Y-axis indicate time (ms) and membrane potentials (mV), respectively. The timing of amplitudewas defined as 0 ms. (b) Time course of averaged amplitudes in the sixteen groups, which is classified by the pattern two history-steps. Each four traces in (a) was subclassified into four groups by the pattern at two time history step. The four graphs indicate subclassified traces of four spatial patterns: upper left, upper right, lower left, and lower right graph showed subdivided responses of “X#100” (black trace), “X#101” (green trace), “X#110” (blue trace), and “X#111” (red trace) in (a), respectively. In each graph, the color of right arrowhead above the traces indicates the timing and spatial pattern of input. Each trace was subclassified into four traces by the spatial pattern of two time-history steps. The color of the trace indicates the two preceding input temporal pattern: red, blue, green, and black indicate "11", "10", "01", and "00", respectively. (c) Time course of averaged amplitudes in the sixty-four groups, which is classified by the pattern three time-history steps. Each of four traces in (b) was subclassified into four groups by the pattern at three time history steps. The sixteen graphs indicate subclassified traces of four spatial patterns: each four graphs of upper, middle upper, middle lower, and lower row showed subdivided responses of “(X#2ij,X#100)” (upper left graph), “(X#2ij,X#101)” (upper right graph), “(X#2ij,X#110)” (lower left graph), and “(X#2ij,X#111)” (lower right graph) in (b), respectively
Fig. 3
Fig. 3
Example of time-course of average amplitude of the responses in supra-threshold group. The relationships among the graphs are consistent with those in Fig.2a–c. Time course of averaged amplitudes in the four (a), sixteen (b), and sixty-four groups (c), which is classified by the pattern one (a), two (b), and three (c) time-history steps sequences, respectively
Fig. 4
Fig. 4
An example of distribution of membrane potentials by one, two, and three time history-steps in sub-threshold group. (a) Standardized cumulative histogram (SCH) of amplitude by the pattern of spatial input at one time-history step. The X-axis indicates the amplitudes (mV, referred also dotted lines in Fig. 2a). The colors of traces indicate the distribution of input spatial patterns: red, blue, green, and black traces indicate the spatial input pattern of “X#100”,“X#101”,“X#110”, and “X#111”, respectively. The Y-axis indicates standard cumulative frequency of amplitudes. (b) SCH by the pattern of spatial input at two time-history steps. The trace in (a) “X#100”,“X#101”,“X#110”, and “X#111” was further subclassified into “(X#2ij,X#100)” (left graph),“(X#2ij,X#101)” (middle left graph),“(X#2ij,X#110)” (middle right graph), and “(X#2ij,X#111)” (right graph) by the pattern at two time-history steps, respectively. In each graph, the distribution of the amplitudes by one time-history step is indicated by the color of the traces: black, green, blue, and red traces indicate the distribution of the response by “X#200”,“X#201”,“X#210”, and “X#211”, respectively. (c) SCH by the pattern of spatial input at three time-history steps. The graph in (b) “(X#2ij,X#100)”, “(X#2ij,X#101)”, “(X#2ij,X#110)”, and “(X#2ij,X#111)” was further subclassified into “(X#3ij,X#2ij,X#100)” (upper four graphs), “(X#3ij,X#2ij,X#101)” (upper middle four graphs), “(X#3ij,X#2ij,X#110)” (lower middle four graphs), and “(X#3ij,X#2ij,X#111)” (lower four graphs) in (c) by the pattern at three time-history steps, respectively. In each graph, the distribution of the amplitudes by three time-history steps is indicated by the color of the traces: black, green, blue, and red traces indicate the distribution of the response by “X#300”,“X#301”,“X#310”, and “X#311”, respectively
Fig. 5
Fig. 5
An example of distribution of membrane potentials by one, two, and three time-history steps in supra-threshold group. The relationship of the graphs is consistent with those in Fig. 4a–c. One (a), four (b), and sixteen (c) SCH histograms of amplitudes subclassified by one (a), two (b), and three (c) time-history steps, respectively
Fig. 6
Fig. 6
Quantitative analysis in spatial clustering and its self-similarity at the pattern of one, two, and three time-history steps. (a) Spatial clustering index at one, two, and three time-history steps under sub-threshold and supra-threshold conditions. The black solid and dotted lines indicate the spatial clustering index under sub-threshold (Sub-Th) and supra-threshold (Supra-Th) conditions, respectively. The gray solid and dotted lines indicate the randomized control for the sub-threshold (Rand(Sub)) and supra-threshold (Rand(Sup)) conditions, respectively. The X- and Y-axis indicate the time-history steps and the spatial clustering index, respectively. In X-axis, #0, #1, and #2 is defined as spatial clustering index classified by 1, 2, and 3 time-history steps, respectively. Error bars indicate standard errors of the mean *P < 0.05. (b) Self-similarity index of the neurons under sub-threshold and supra-threshold conditions. The X- and Y-axis indicate the pair of time-history steps and the self-similarity index, respectively. Error bars indicate standard errors of the mean *P < 0.05
Fig. 7
Fig. 7
NMDA-receptor participation on spatial clustering and its self-similarity. The relationship of the graphs is consistent with those in Fig. 6a–b. Spatial clustering index (a) at one and two, and three time-history steps and (b) self-similarity index at the pairs of one and two, and one and three under 50 μM APV applied conditions were shown

Similar articles

Cited by

References

    1. {'text': '', 'ref_index': 1, 'ids': [{'type': 'DOI', 'value': '10.1002/(SICI)1098-1063(1997)7:4<416::AID-HIPO7>3.0.CO;2-G', 'is_inner': False, 'url': 'https://doi.org/10.1002/(sici)1098-1063(1997)7:4<416::aid-hipo7>3.0.co;2-g'}, {'type': 'PubMed', 'value': '9287081', 'is_inner': True, 'url': 'https://pubmed.ncbi.nlm.nih.gov/9287081/'}]}
    2. Aihara T, Tsukada M, Crair MC, Shinomoto S (1997) Stimulus-dependent induction of long-term potentiation in CA1 area of the hippocampus: experiment and model. Hippocampus 7(4):416–426 - PubMed
    1. {'text': '', 'ref_index': 1, 'ids': [{'type': 'DOI', 'value': '10.1016/j.neuroscience.2006.11.025', 'is_inner': False, 'url': 'https://doi.org/10.1016/j.neuroscience.2006.11.025'}, {'type': 'PubMed', 'value': '17223275', 'is_inner': True, 'url': 'https://pubmed.ncbi.nlm.nih.gov/17223275/'}]}
    2. Aihara T, Abiru Y, Yamazaki Y, Watanabe H, Fukushia Y, Tsukada M (2007) The relation between spike-timing dependent plasticity and Ca2+ dynamics in the hippocampal CA1 network. Neuroscience 145:80–87 - PubMed
    1. {'text': '', 'ref_index': 1, 'ids': [{'type': 'DOI', 'value': '10.1007/s004220050018', 'is_inner': False, 'url': 'https://doi.org/10.1007/s004220050018'}, {'type': 'PubMed', 'value': '10664105', 'is_inner': True, 'url': 'https://pubmed.ncbi.nlm.nih.gov/10664105/'}]}
    2. Aihara T, Tsukada M, Matsuda H (2000) Two dynamic processes for the induction of long-term potentiation in hippocampal CA1 area. Biol Cybern 82:189–195 - PubMed
    1. {'text': '', 'ref_index': 1, 'ids': [{'type': 'PMC', 'value': 'PMC6763889', 'is_inner': False, 'url': 'https://pmc.ncbi.nlm.nih.gov/articles/PMC6763889/'}, {'type': 'PubMed', 'value': '11717348', 'is_inner': True, 'url': 'https://pubmed.ncbi.nlm.nih.gov/11717348/'}]}
    2. Andrasfalvy BK, Magee JC (2001) Distance dependent increase in AMPA receptor number in the dendrites of adult hippocampal CA1 pyramidal neurons. J Neurosci 21(23):9151–9159 - PMC - PubMed
    1. {'text': '', 'ref_index': 1, 'ids': [{'type': 'DOI', 'value': '10.1126/science.1099745', 'is_inner': False, 'url': 'https://doi.org/10.1126/science.1099745'}, {'type': 'PubMed', 'value': '15218136', 'is_inner': True, 'url': 'https://pubmed.ncbi.nlm.nih.gov/15218136/'}]}
    2. Buzsaki G, Draguhn A (2004) Neuronal oscillations in cortical networks. Science 304(5679):1926–1929 - PubMed