Analysis of the electrochemistry of hemes with E(m)s spanning 800 mV
- PMID: 19003997
- PMCID: PMC2727069
- DOI: 10.1002/prot.22282
Analysis of the electrochemistry of hemes with E(m)s spanning 800 mV
Abstract
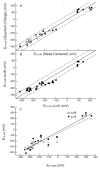
The free energy of heme reduction in different proteins is found to vary over more than 18 kcal/mol. It is a challenge to determine how proteins manage to achieve this enormous range of E(m)s with a single type of redox cofactor. Proteins containing 141 unique hemes of a-, b-, and c-type, with bis-His, His-Met, and aquo-His ligation were calculated using Multi-Conformation Continuum Electrostatics (MCCE). The experimental E(m)s range over 800 mV from -350 mV in cytochrome c(3) to 450 mV in cytochrome c peroxidase (vs. SHE). The quantitative analysis of the factors that modulate heme electrochemistry includes the interactions of the heme with its ligands, the solvent, the protein backbone, and sidechains. MCCE calculated E(m)s are in good agreement with measured values. Using no free parameters the slope of the line comparing calculated and experimental E(m)s is 0.73 (R(2) = 0.90), showing the method accounts for 73% of the observed E(m) range. Adding a +160 mV correction to the His-Met c-type hemes yields a slope of 0.97 (R(2) = 0.93). With the correction 65% of the hemes have an absolute error smaller than 60 mV and 92% are within 120 mV. The overview of heme proteins with known structures and E(m)s shows both the lowest and highest potential hemes are c-type, whereas the b-type hemes are found in the middle E(m) range. In solution, bis-His ligation lowers the E(m) by approximately 205 mV relative to hemes with His-Met ligands. The bis-His, aquo-His, and His-Met ligated b-type hemes all cluster about E(m)s which are approximately 200 mV more positive in protein than in water. In contrast, the low potential bis-His c-type hemes are shifted little from in solution, whereas the high potential His-Met c-type hemes are raised by approximately 300 mV from solution. The analysis shows that no single type of interaction can be identified as the most important in setting heme electrochemistry in proteins. For example, the loss of solvation (reaction field) energy, which raises the E(m), has been suggested to be a major factor in tuning in situ E(m)s. However, the calculated solvation energy vs. experimental E(m) shows a slope of 0.2 and R(2) of 0.5 thus correlates weakly with E(m)s. All other individual interactions show even less correlation with E(m). However the sum of these terms does reproduce the range of observed E(m)s. Therefore, different proteins use different aspects of their structures to modulate the in situ heme electrochemistry. This study also shows that the calculated E(m)s are relatively insensitive to different heme partial charges and to the protein dielectric constant used in the simulation.
Figures


Similar articles
-
How cytochromes with different folds control heme redox potentials.Biochemistry. 2003 Aug 26;42(33):9829-40. doi: 10.1021/bi027288k. Biochemistry. 2003. PMID: 12924932
-
Electrostatic environment of hemes in proteins: pK(a)s of hydroxyl ligands.Biochemistry. 2006 Jul 4;45(26):7949-58. doi: 10.1021/bi052182l. Biochemistry. 2006. PMID: 16800621 Free PMC article.
-
Evaluating the roles of the heme a side chains in cytochrome c oxidase using designed heme proteins.Biochemistry. 2006 Oct 17;45(41):12530-8. doi: 10.1021/bi060565t. Biochemistry. 2006. PMID: 17029408
-
Insight into heme protein redox potential control and functional aspects of six-coordinate ligand-sensing heme proteins from studies of synthetic heme peptides.Inorg Chem. 2006 Dec 11;45(25):9985-10001. doi: 10.1021/ic052205k. Inorg Chem. 2006. PMID: 17140194
-
Review: studies of ferric heme proteins with highly anisotropic/highly axial low spin (S = 1/2) electron paramagnetic resonance signals with bis-histidine and histidine-methionine axial iron coordination.Biopolymers. 2009 Dec;91(12):1064-82. doi: 10.1002/bip.21267. Biopolymers. 2009. PMID: 19536822 Free PMC article. Review.
Cited by
-
Modular origins of biological electron transfer chains.Proc Natl Acad Sci U S A. 2018 Feb 6;115(6):1280-1285. doi: 10.1073/pnas.1714225115. Epub 2018 Jan 22. Proc Natl Acad Sci U S A. 2018. PMID: 29358375 Free PMC article.
-
Modification of quinone electrochemistry by the proteins in the biological electron transfer chains: examples from photosynthetic reaction centers.J Bioenerg Biomembr. 2008 Oct;40(5):509-19. doi: 10.1007/s10863-008-9179-1. Epub 2008 Nov 1. J Bioenerg Biomembr. 2008. PMID: 18979192 Free PMC article. Review.
-
Modulation of ligand-field parameters by heme ruffling in cytochromes c revealed by EPR spectroscopy.Inorg Chem. 2011 Dec 5;50(23):12018-24. doi: 10.1021/ic201479q. Epub 2011 Nov 1. Inorg Chem. 2011. PMID: 22044358 Free PMC article.
-
Tailorable Tetrahelical Bundles as a Toolkit for Redox Studies.J Phys Chem B. 2022 Oct 20;126(41):8177-8187. doi: 10.1021/acs.jpcb.2c05119. Epub 2022 Oct 11. J Phys Chem B. 2022. PMID: 36219580 Free PMC article.
-
Assessing Thermal Response of Redox Conduction for Anti-Arrhenius Kinetics in a Microbial Cytochrome Nanowire.J Phys Chem B. 2022 Dec 8;126(48):10083-10097. doi: 10.1021/acs.jpcb.2c06822. Epub 2022 Nov 23. J Phys Chem B. 2022. PMID: 36417757 Free PMC article.
References
-
- Dutton PL. Redox potentiometry: determination of midpoint potentials of oxidation-reduction components of biological electron-transfer systems. Methods Enzymol. 1978;54:411–435. - PubMed
-
- Wilson GS. Determination of oxidation-reduction potentials. Methods Enzymol. 1978;54:396–410. - PubMed
-
- Chapman SK, Daff S, Munro AW. Heme: the most versatile redox centre in biology? Metal Sites Proteins Models. 1997;88:39–70.
-
- Pettigrew GW, Moore GR. In: Cytochromes c: biological aspects. Rich A, editor. Berlin: Springer-Verlag; 1987.
-
- Guengerich FP, Miller GP, Hanna IH, Martin MV, Leger S, Black C, Chauret N, Silva JM, Trimble LA, Yergey JA, Nicoll-Griffith DA. Diversity in the oxidation of substrates by cytochrome P450 2D6: lack of an obligatory role of aspartate 301-substrate electrostatic bonding. Biochemistry. 2002;41:11025–11034. - PubMed
Publication types
MeSH terms
Substances
Grants and funding
LinkOut - more resources
Full Text Sources
Miscellaneous

