. 2008 Nov 18;105(46):17789-94.
doi: 10.1073/pnas.0808882105. Epub 2008 Nov 12.

Optical lock-in detection imaging microscopy for contrast-enhanced imaging in living cells

Affiliations

Optical lock-in detection imaging microscopy for contrast-enhanced imaging in living cells

Gerard Marriott et al. Proc Natl Acad Sci U S A. .

Abstract

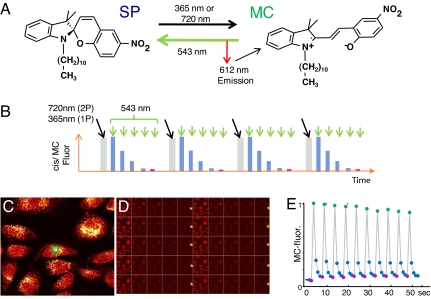
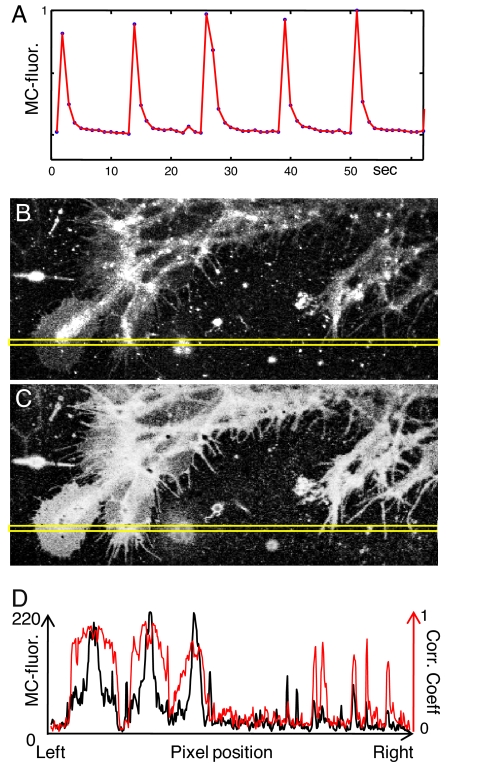
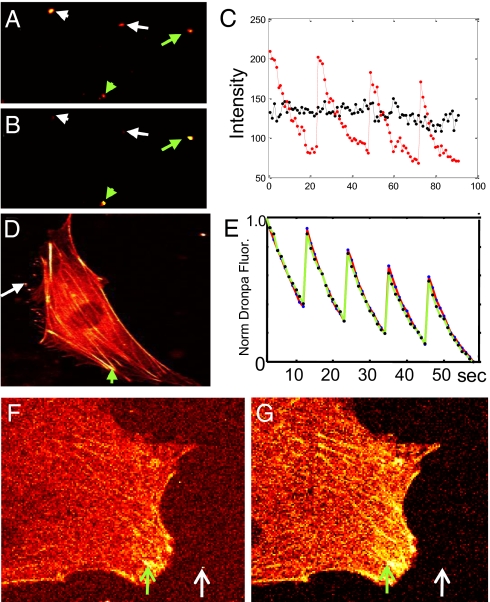
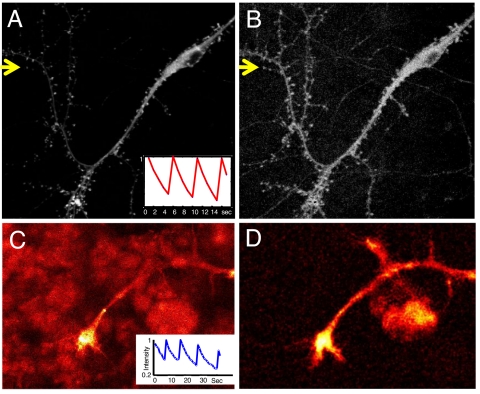
One of the limitations on imaging fluorescent proteins within living cells is that they are usually present in small numbers and need to be detected over a large background. We have developed the means to isolate specific fluorescence signals from background by using lock-in detection of the modulated fluorescence of a class of optical probe termed "optical switches." This optical lock-in detection (OLID) approach involves modulating the fluorescence emission of the probe through deterministic, optical control of its fluorescent and nonfluorescent states, and subsequently applying a lock-in detection method to isolate the modulated signal of interest from nonmodulated background signals. Cross-correlation analysis provides a measure of correlation between the total fluorescence emission within single pixels of an image detected over several cycles of optical switching and a reference waveform detected within the same image over the same switching cycles. This approach to imaging provides a means to selectively detect the emission from optical switch probes among a larger population of conventional fluorescent probes and is compatible with conventional microscopes. OLID using nitrospirobenzopyran-based probes and the genetically encoded Dronpa fluorescent protein are shown to generate high-contrast images of specific structures and proteins in labeled cells in cultured and explanted neurons and in live Xenopus embryos and zebrafish larvae.


Conflict of interest statement

Conflict of interest statement: Related probes to those detailed in this article have been patented by G.M. through the Wisconsin Alumni Research Foundation (WARF).

Figures

Fig. 1.
Fig. 1.
Cyclic excitation repeatedly switches nitroBIPS fluorescence on and off. (A) Structure and excited-state reactions of the C11-nitroBIPS optical switch. Excitation of nonfluorescent SP state with either 2-photon (720 nm) or single-photon near-UV (365 nm) light elicits isomerization to fluorescent MC state. Subsequent excitation of MC (543 nm) induces red fluorescence or photoisomerization to the nonfluorescent SP state. (B) Defined waveform of optical perturbation of nitroBIPS results in deterministic control of fluorescent and nonfluorescent states. Progress of photochemical reactions is detected by using the fluorescence of the MC-state of nitroBIPS. (C–E) Cycling MC-fluorescence in live NIH 3T3 cells loaded with thiol-reactive 8-IodomethylBIPS. (C) Single image of cells at peak fluorescence. (D) Ten cycles of optical switching as seen in MC-fluorescence images of cells shown in C. Each cycle consists of a 100-ms pulse of 365-nm light (yellow asterisk), followed by a series of 1-s scans of the field using 543 nm and imaged with a 560-nm long-pass filter. (E) Trace of the normalized modulated intensity of MC-fluorescence (internal reference waveform) in one cell (C, green box) over 10 cycles of optical switching.
Fig. 2.
Fig. 2.
OLID for imaging live Xenopus spinal cord explants using nitroBIPS probes. (A) Internal reference waveform for the optical switching of C11-nitroBIPS in cells within a Xenopus spinal cord explants measured by using MC-fluorescence. The normalized waveform was obtained from a selected region of 5 × 5 pixels with strongest MC-fluorescence corresponding to 5 cycles of optical switching of the probe and was used in the pixel-by-pixel calculation of the correlation coefficient. (B) Fluorescence-intensity image of the C11-nitroBIPS stained cells within the Xenopus spinal cord explant. (C) Correlation image corresponding to B, which used A as a reference waveform. (D) Traces of the relative fluorescence intensity (black) and the correlation (red) of C11-nitroBIPS for the yellow boxed region in B and C, respectively.
Fig. 3.
Fig. 3.
Optical switching of Dronpa. (A) Intensity image of Dronpa-beads (green arrows) mixed with a cluster of 40-nm fluoresbrite beads (white arrows). (B) Correlation image of same image field as in A shows the Dronpa-beads but not the 40-nm fluoresbrite beads. (C) Fluorescence-intensity profiles for optical switching of a single 0.35-μm Dronpa-latex bead [red trace from bead marked with the short green arrow (A)] and the uncorrelated and much more constant intensity from the fluoresbrite bead cluster (black trace from bead marked with the short white arrow in A). Optical cycling was achieved by using a single 100-ms pulse of 365-nm light to convert nonfluorescent trans-Dronpa to the fluorescent cis-Dronpa and 488-nm excitation to evoke fluorescence and the reverse isomerization. The fluoresence-intensity axis applies to both profiles. (D) Image of Dronpa-actin in a living NIH 3T3 cell (green arrow) compared with Dronpa-coupled 1-μm latex beads (white arrow). Beads were used to generate an external reference waveform of optical switching. Transition to the fluorescent cis state is triggered by excitation of the trans state at 365 nm for 100 ms. Subsequent excitation of cis-Dronpa at 488 nm is used to bring about the cis-to-trans photoisomerization. (E) Normalized fluorescence-intensity profiles of cis-Dronpa in a stress fiber in the NIH 3T3 cell (green arrow in D; red trace, with data shown as blue dots) and a Dronpa-bead located next to the cell (white arrow in Fig. D; green trace, with data shown as black dots) over the course of 5 cycles of optical switching. Note that the internal reference waveform generated from Dronpa-actin in the live cell is almost identical to that of the external reference waveform derived from Dronpa on the bead. (F and G) Fluorescence-intensity (F) and correlation (G) images of Dronpa-actin in NIH 3T3 cell (Intensity scale is 0–255, and the correlation coefficient is 0–1). The intensity image was taken immediately after a 200-ms 365-nm pulse. GFP-coupled latex beads (0.35 μm) were added to the external medium to add a milky background signal with bright spots, presumably representing bead aggregates (white arrow). The green arrow indicates the location of a focal contact, containing a high concentration of Dronpa-actin, that was used to generate an internal reference waveform.
Fig. 4.
Fig. 4.
OLID-imaging of Dronpa in cultured mammalian neurons and Xenopus spinal cord explant. (A) Fluorescence-intensity image of Dronpa-actin transiently expressed in rat P1 hippocampal neurons, transfected at 8 days in vitro (DIV) and imaged in live cells at 11 DIV. The Inset shows normalized fluorescence intensity of the internal reference over 3 cycles of optical switching. (B) Correlation image of Dronpa-actin of same field as in A improves contrast and reveals finer processes and dendritic spines. Profiles of the fluorescence intensity and correlation coefficient along a line defined by the yellow arrows (A and B, respectively) are shown in Fig. S3. (C) Image of the fluorescence intensity of cis-Dronpa-actin within the growth cone of a motor neuron in a live, deskinned Xenopus embryo. The Inset shows the internal reference waveform derived from optical switching of Dronpa-actin in the cell body. (D) Correlation image of Dronpa-actin for image field shown in C. The improvement in contrast in the correlation image is largely from the suppression of background of the muscle cells that is evident in the intensity image. (For details see SI Text).
Fig. 5.
Fig. 5.
OLID-imaging of Dronpa in live zebrafish. (A–C) OLID imaging of Dronpa-actin in muscle of live zebrafish larva. (A and B) Fluorescence-intensity image (A) and correlation-coefficient image (B) of Dronpa-actin in larval muscle at 5 dpf. Note that details of sarcomeric organization are sharper in the correlation coefficient image. The green arrow indicates the region that has considerable background fluorescence but little to no correlation, suggesting an absence of Dronpa-actin. (C) Saw-tooth modulation of the normalized fluorescence intensity by optical switching between trans- and cis-Dronpa-actin in zebrafish muscle of A. (D and E) OLID imaging of cytoplasmic Dronpa in neurons of live zebrafish larva. Fluorescence-intensity image (D) and correlation image (E) and modulation of the normalized fluorescence intensity by optical switching (D Inset) of cytoplasmic Dronpa in spinal cord interneurons in larva at 5 dpf. Profiles of the intensity and correlation coefficient for these data along a narrow box defined by the yellow arrows are shown in Fig. S4

Similar articles

Cited by

References

    1. Yan Y, Marriott G. Analysis of protein interactions using fluorescence technologies. Curr Opin Chem Biol. 2003;7:635–640. - PubMed
    1. Zhang J, Campbell R, Ting A, Tsien R. Creating new fluorescent probes for cell biology. Nat Rev Mol Cell Biol. 2002;3:906–918. - PubMed
    1. Westphal M, et al. Microfilament dynamics in motility and cytokinesis imaged with GFP-actin. Curr Biol. 1997;7:176. - PubMed
    1. Axelrod D. Total internal reflection fluorescence microscopy in cell biology. Methods Enzymol. 2003;361:1–33. - PubMed
    1. Koyama-Honda I, et al. Fluorescence imaging for monitoring the colocalization of two single molecules in living cells. Biophys J. 2005;88:2126–2136. - PMC - PubMed

Publication types

LinkOut - more resources