. 2008 Nov 12;28(46):11906-15.
doi: 10.1523/JNEUROSCI.3827-08.2008.

Adaptation of firing rate and spike-timing precision in the avian cochlear nucleus

Affiliations

Adaptation of firing rate and spike-timing precision in the avian cochlear nucleus

Marina S Kuznetsova et al. J Neurosci. .

Abstract

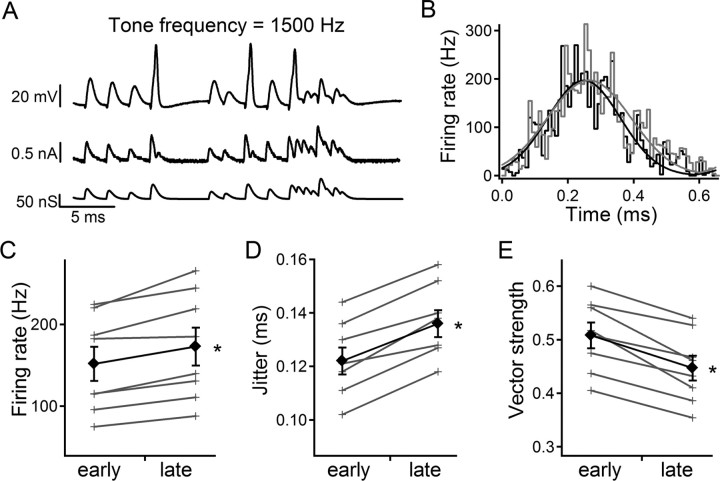
Adaptation is commonly defined as a decrease in response to a constant stimulus. In the auditory system such adaptation is seen at multiple levels. However, the first-order central neurons of the interaural time difference detection circuit encode information in the timing of spikes rather than the overall firing rate. We investigated adaptation during in vitro whole-cell recordings from chick nucleus magnocellularis neurons. Injection of noisy, depolarizing current caused an increase in firing rate and a decrease in spike time precision that developed over approximately 20 s. This adaptation depends on sustained depolarization, is independent of firing, and is eliminated by alpha-dendrotoxin (0.1 microM), implicating slow inactivation of low-threshold voltage-activated K+ channels as its mechanism. This process may alter both firing rate and spike-timing precision of phase-locked inputs to coincidence detector neurons in nucleus laminaris and thereby adjust the precision of sound localization.


Figures

Figure 1.
Figure 1.
NM neurons increase firing rate in response to depolarizing, fluctuating inputs. A, Schematic diagram showing the circuitry of the first-order (NM) and second-order (NL) CNS neurons in the chick auditory system and the in vitro recording location. B, Voltage response of an NM neuron to a depolarizing, noisy current injection. C, PSTH (black trace; left axis) and average membrane voltage (gray trace; right axis) of a response to a 20-s-long, depolarizing noisy current injection averaged over 250 ms bins. The inset shows the PSTH of the initial 600 ms of the response averaged over 50 ms bins. The solid black lines are exponential fits to the rapid decrease (inset plot) and slow increase in firing rate.
Figure 2.
Figure 2.
The rate increase requires sustained depolarization and is independent of firing. A, PSTH (top) and voltage response (middle) of an NM neuron to a 5-s-long current step containing noise plus a depolarizing DC component to give a positive mean (bottom). B, PSTH and voltage response of the same neuron to a 5-s-long noisy input with zero mean. C, PSTH and voltage response of an NM neuron to a 5-s-long depolarizing current injection with noise during the first and last seconds only; note the absence of firing in the absence of noise. D, Change in mean firing rate between 0 and 1, and 4 and 5 s after the stimulus onset for a positive-mean stimulus (n = 30), zero-mean stimulus (n = 16), and a positive-mean “no noise” stimulus (n = 13). Error bars represent SE (z test, *p < 0.01).
Figure 3.
Figure 3.
α-DTX blocks IKlt and the slow rate increase. A, PSTH (top), voltage response or command (middle), and current injection or response (bottom) of an NM neuron in hybrid clamp in normal ACSF. The dotted line represents the recording mode versus time (VC, voltage clamp; IC, current clamp). The arrow indicates the large, slowly inactivating outward current during the depolarizing voltage-clamp step. B, PSTH, voltage, and current (as in A) of the same neuron in the presence of 100 nm α-DTX. The arrow shows the reduced outward current during the depolarizing voltage-clamp step. C, Mean change in firing rate versus conditioning voltage for NM neurons in control ACSF (n = 14; open triangles) and 100 nm α-DTX (n = 7; filled diamonds; *p < 0.01, Bonferroni's corrected t test). Error bars represent SE.
Figure 4.
Figure 4.
Recovery from IKlt inactivation and recovery from firing rate adaptation follow similar time courses. A, Recovery from IKlt inactivation. The top two traces show the current generated in response to voltage-clamp steps. Two sweeps with different recovery intervals are superimposed in black and gray. The bottom panel is a plot of the amount of recovery from IKlt inactivation versus recovery interval at −50 mV (n = 10), −60 mV (n = 8), −70 mV (n = 7), and −80 mV (n = 6). The dashed lines are single-exponential fits to the data. Error bars equal SE. B, Same layout as in A but for recovery from firing rate adaptation in hybrid-clamp mode. The dotted black and gray lines indicate times spent in voltage clamp (VC) and current clamp (IC) for the like-shaded traces. The bottom panel is a plot of the recovery of firing rate from adaptation versus the recovery interval at −60 or −70 mV (n = 8). The dashed lines are exponential fits to the data. C, Plot of the mean recovery time constants (from the exponential fits) versus the recovery voltage for IKlt inactivation (open triangles) and firing rate adaptation (filled squares) (*p < 0.01, Bonferroni's corrected t test). Error bars represent SE.
Figure 5.
Figure 5.
Adaptation decreases spike-timing precision in NM. A, Example of a “frozen noise” stimulus used to measure changes in spike jitter; a and b indicate identical noise segments. B, Response of an NM neuron to three repeats of the stimulus shown in A. The numbered rasters show the time of spikes during noise segment a (top raster; black) and during noise segment b (bottom raster; blue, “old” spikes; red, “new” spikes). C, Change in spike jitter for early (200–700 ms after stimulus onset) and late response (4200–4700 ms) (gray crosses, individual cells; black diamonds, group average; n = 13; p = 0.4; error bars represent SE). D, Mean spike jitter versus spike type (see text) (n = 8; *p < 0.05, paired t test). Error bars represent SE.
Figure 6.
Figure 6.
Adaptation allows more slowly rising current fluctuations to elicit spikes. A, Rasters of spike times evoked during the initial and final segment of a noise stimulus as in Figure 5, but with a different noise stimulus during each sweep. B, Example of spike-triggered average current (STA) for early (black line), old (blue line), and new spikes (red line). C, Change in the STA for early versus old spikes (blue) or early versus new spikes (red). Changes for the maximum slope of the STA (peak value of the first derivative), and amplitude of the negative and positive components of the STA for the new or old spikes relative to the early spikes were calculated by the following formulas: [(XnewXearly)/Xearly]*100% or [(XoldXearly)/Xearly]*100%, respectively (n = 5; *p < 0.01, paired t test).
Figure 7.
Figure 7.
Physiological patterns of simulated excitatory synaptic conductance can cause a slow rate increase. A, Example of a conductance stimulus (bottom), the resulting injected current (middle), and the voltage response (top) in dynamic clamp. B, PSTH of responses to simulated synaptic inputs phase-locked to 500 and 1000 Hz. C, Mean change in firing rate versus the phase-locking frequency imposed on the simulated synaptic inputs (n indicated above each bar). Error bars represent SE (z test, *p < 0.01).
Figure 8.
Figure 8.
Adaptation decreases spike-timing precision in NM in response to simulated physiological inputs. A, Example of a conductance stimulus (bottom), the resulting injected current (middle), and the voltage response (top) in dynamic clamp. B, Cycle PSTH of the early (black) and late (gray) responses. The solid lines are Gaussian fits to the data. C, Firing rate for early and late response (gray crosses, individual cells; black diamonds, group average; n = 13). D, Spike jitter for early and late response. E, Vector strength for early and late response. For C–E, the error bars represent SE (*p < 0.01, paired t test).

Similar articles

Cited by

References

    1. Avissar M, Furman AC, Saunders JC, Parsons TD. Adaptation reduces spike-count reliability, but not spike-timing precision, of auditory nerve responses. J Neurosci. 2007;27:6461–6472. - PMC - PubMed
    1. Bacci A, Huguenard JR. Enhancement of spike-timing precision by autaptic transmission in neocortical inhibitory interneurons. Neuron. 2006;49:119–130. - PubMed
    1. Billimoria CP, DiCaprio RA, Birmingham JT, Abbott LF, Marder E. Neuromodulation of spike-timing precision in sensory neurons. J Neurosci. 2006;26:5910–5919. - PMC - PubMed
    1. Brenowitz S, Trussell LO. Maturation of synaptic transmission at end-bulb synapses of the cochlear nucleus. J Neurosci. 2001;21:9487–9498. - PMC - PubMed
    1. Brew HM, Forsythe ID. Two voltage-dependent K+ conductances with complementary functions in postsynaptic integration at a central auditory synapse. J Neurosci. 1995;15:8011–8022. - PMC - PubMed

Publication types

Substances

LinkOut - more resources