. 2008 Nov 12;28(46):12039-51.
doi: 10.1523/JNEUROSCI.3568-08.2008.

Neurotoxic activation of microglia is promoted by a nox1-dependent NADPH oxidase

Affiliations

Neurotoxic activation of microglia is promoted by a nox1-dependent NADPH oxidase

Cyril Chéret et al. J Neurosci. .

Abstract

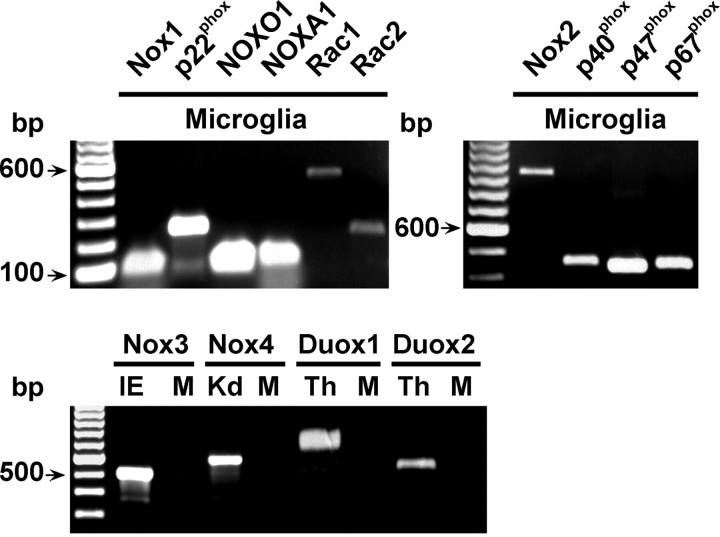
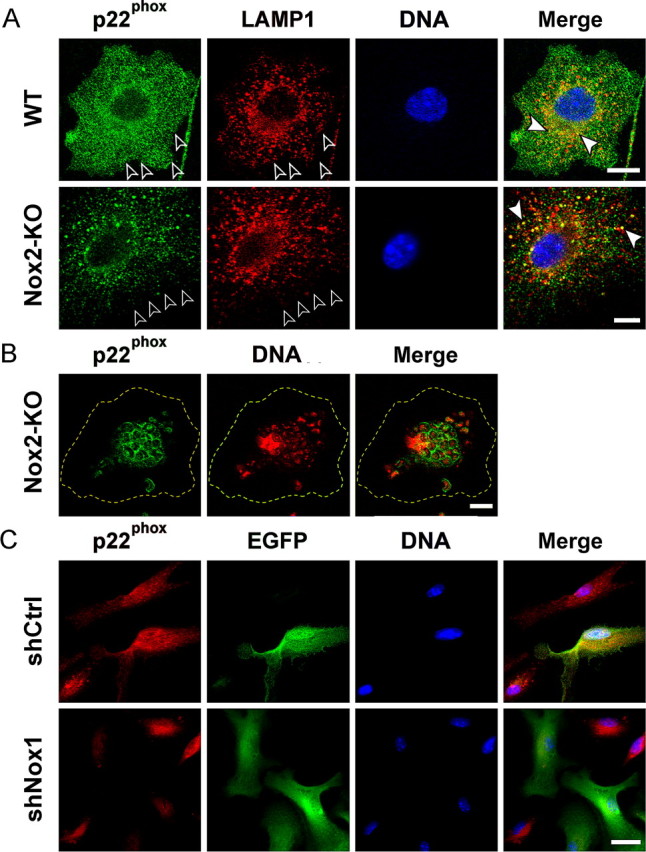
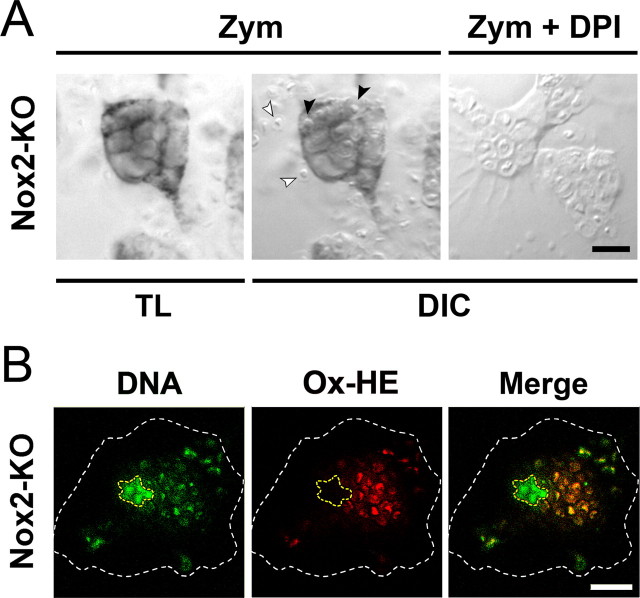
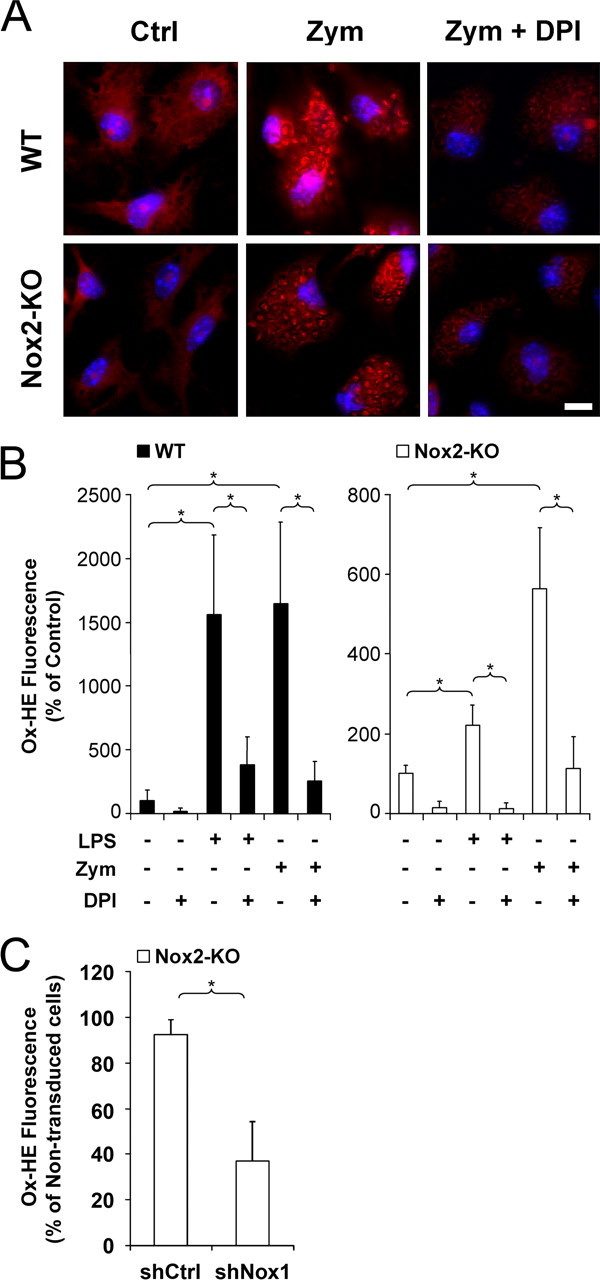
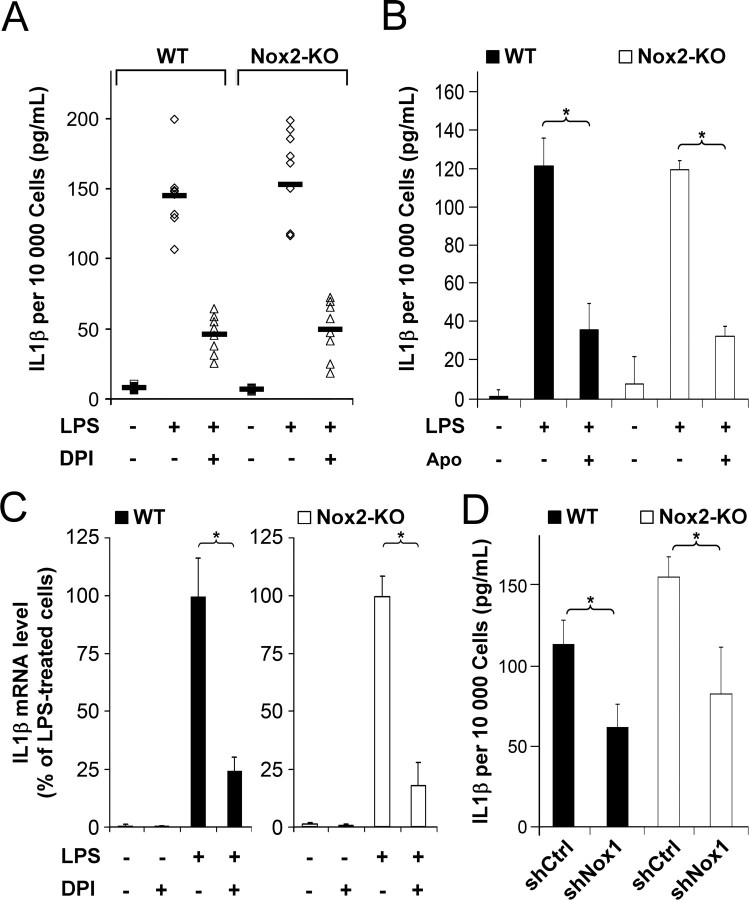
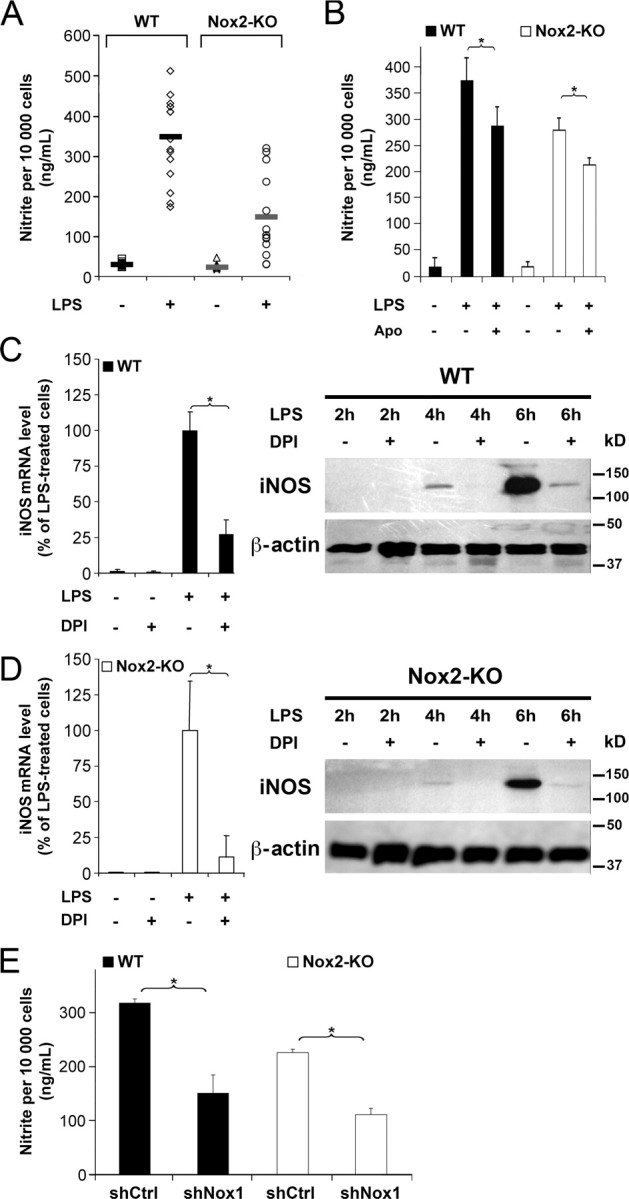
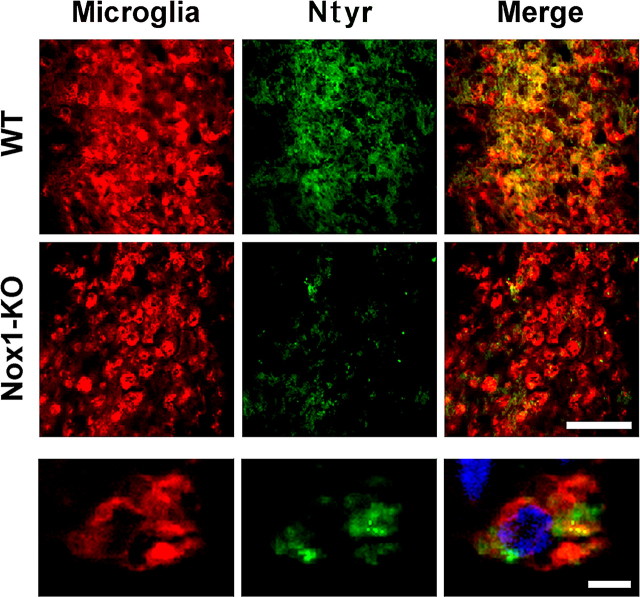
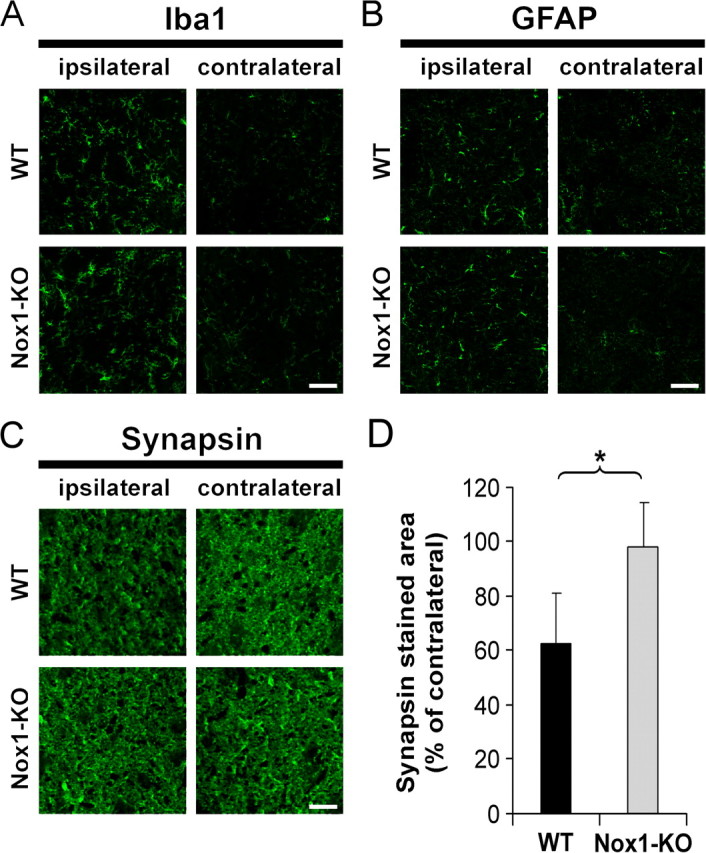
Reactive oxygen species (ROS) modulate intracellular signaling but are also responsible for neuronal damage in pathological states. Microglia, the resident CNS macrophages, are prominent sources of ROS through expression of the phagocyte oxidase which catalytic subunit Nox2 generates superoxide ion (O2(.-)). Here we show that microglia also express Nox1 and other components of nonphagocyte NADPH oxidases, including p22(phox), NOXO1, NOXA1, and Rac1/2. The subcellular distribution and functions of Nox1 were determined by blocking Nox activity with diphenylene iodonium or apocynin, and by silencing the Nox1 gene in microglia purified from wild-type (WT) or Nox2-KO mice. [Nox1-p22(phox)] dimers localized in intracellular compartments are recruited to phagosome membranes during microglial phagocytosis of zymosan, and Nox1 produces O2(.-) in zymosan-loaded phagosomes. In microglia activated with lipopolysaccharide (LPS), Nox1 produces O2(.-), which enhances cell expression of inducible nitric oxide synthase and secretion of interleukin-1beta. Comparisons of microglia purified from WT, Nox2-KO, or Nox1-KO mice indicate that both Nox1 and Nox2 are required to optimize microglial production of nitric oxide. By injecting LPS in the striatum of WT and Nox1-KO mice, we show that Nox1 also enhances microglial production of cytotoxic nitrite species and promotes loss of presynaptic proteins in striatal neurons. These results demonstrate the functional expression of Nox1 in resident CNS phagocytes, which can promote production of neurotoxic compounds during neuroinflammation. Our study also shows that Nox1- and Nox2-dependent oxidases play distinct roles in microglial activation and that Nox1 is a possible target for the treatment of neuroinflammatory states.


Figures

Figure 1.
Figure 1.
Microglia express the genes encoding Nox1- and Nox2-dependent NADPH oxidases. Ethidium bromide-stained agarose gels of reverse transcription-PCR products generated from Nox1, p22phox, NOXO1, NOXA1, Rac1, Rac2, Nox2, p40phox, p47phox, and p67phox mRNA in microglia purified by FACS from CX3CR1EGFP/+ mice or from Nox3, Nox4, Duox1, or Duox2 mRNA in FACS-purified CX3CR1EGFP/+ microglia (M), inner ear from P3 mice (IE), kidney from 16-d-old mice embryos (Kd), or adult mouse thyroid (Th). IE, Kd, and Th were from WT mice and were used as positive controls.
Figure 2.
Figure 2.
Nox1- and Nox2-dependent localization of p22phox in microglia. A, Codetection of p22phox (anti-p22phox, green), lysosomes (anti-LAMP1, red), and nuclei (Hoechst 33342, blue) in cultured WT or Nox2-KO microglia. Plasma membranes are outlined by open arrowheads. White arrowheads point to lysosomal p22phox in merged views (confocal microscopy). Scale bars, 10 μm. B, Detection of p22phox (green) and nucleic acid (Hoechst staining, blue fluorescence converted to red) in a Nox2-KO murine microglial cell after microglial phagocytosis of yeast particles (zymosan). The plasma membrane is outlined in yellow. Cultured cells were incubated with zymosan for 45 min before fixation and staining. Note the localization of p22phox in phagosome membranes surrounding stained nucleic acid of yeast particles (confocal microscopy). Scale bar, 10 μm. C, Suppression of p22phox expression in Nox2-KO microglial cells transduced with shNox1. Cultures of purified Nox2-KO microglia were transduced with lentiviral shNox1 or shCtrl and cultured for 3 d before fixation and codetection of p22phox (anti-p22phox, red) and EGFP (anti-EGFP, green). Cells transduced with lentiviral shRNA express EGFP. Scale bar, 20 μm.
Figure 3.
Figure 3.
Detection of phagosomal O2·− in Nox2-KO microglia engulfing zymosan. A, Cultured Nox2-KO microglia were incubated for 30 min with zymosan (Zym) in the absence or the presence of DPI, before addition of NBT to the culture for 15 min. TL, Transmitted light. DIC, Differential interference contrast. White and black arrowheads indicate extracellular and engulfed yeast particles, respectively. The dark blue formazan deposit overlying the phagosomal membrane is not observed in DPI-treated cells. B, Red fluorescence emitted by oxidized hydroethidine (Ox-HE) in a Nox2-KO microglial cell (same cell as in Fig. 2B) after a 45 min incubation with zymosan in the presence of cell-permeant hydroethidine. The DNA of the cell and engulfed zymosan were counterstained with Hoechst 33342 (blue fluorescence converted to green), and the cell nucleus and the plasma membrane are outlined in yellow and white, respectively. Ox-HE fluorescence is colocalized with the DNA of engulfed zymosan (confocal microscopy). Scale bars, 10 μm.
Figure 4.
Figure 4.
Contributions of Nox1 and Nox2 to intracellular O2·− levels in activated microglia. A, B, Cultured WT and Nox2-KO microglia were incubated for 45 min with cell-permeant hydroethidine in the absence (Ctrl) or the presence of LPS or zymosan and with or without DPI before assessment of hydroethidine oxidation. A, Red fluorescence resulting of hydroethidine oxidation in cells that have ingested zymosan. Strongly enhanced fluorescence is localized in phagosomes containing zymosan in WT or Nox2-KO cells. Fluorescence is strongly reduced when cells are incubated with DPI. Hoechst 33342 dye counterstaining (blue) reveals cell nuclei. Scale bar, 10 μm. B, Levels of oxidized hydroethidine (Ox-HE) were determined by fluorescence intensity normalized to the number of cells and are expressed as the percentage of the mean control value determined in cultures without LPS, zymosan or DPI. In zymosan-treated cultures, Ox-HE levels were determined in cells containing at least 10 zymosan particles. Data are the mean ± SD of two (Nox2-KO cells) or three (WT cells) separate experiments with 5–15 determinations in sister wells per experiment. The asterisk indicates significant differences (*p < 0.01; one-way ANOVA followed by Student-Newman–Keuls multiple-comparisons test). C, Nox2-KO cells were transduced with lentiviral shNox1 or shCtrl before incubation with hydroethidine in the presence of LPS. Levels of oxidized hydroethidine (Ox-HE) were determined in transduced (EGFP-stained) and nontransduced cells and are expressed as the percentage of the mean value of nontransduced cells in each well. A total of 600 cells were assessed in each well. The mean proportion of assessed cells expressing EGFP was 38%. Data are mean ± SD from six determinations in sister wells (*p < 0.001 in Welch's t test).
Figure 5.
Figure 5.
Nox1 promotes microglial production of IL-1β. A, B, ELISA determination of IL-1β levels in the medium of WT or Nox2-KO microglial cultures treated or not with indicated reagents for 16 h. A, Dots represent mean values in eight WT and eight Nox2-KO independent experiments (5–6 determinations in sister wells per experiment). Bold lines indicate the mean value calculated from the means of the independent experiments. B, Apocynin (Apo) was used. For each genotype, data are mean ± SD of six determinations in sister wells from a representative experiment (*p < 0.001, SNK test). C, Real-time PCR determination of IL-1β mRNA levels in cultures treated for 150 min. IL-1β levels are expressed as percentage of the mean value determined in LPS-treated cultures. Data are the mean ± SD of three independent experiments with two determinations in sister wells per experiment (*p < 0.001). D, Microglial cultures transduced with lentiviral shNox1 or shCtrl were treated with LPS for 16 h before ELISA detection of IL-1β. For each genotype, data are mean ± SD of six determinations in sister wells from a representative experiment (*p < 0.001, Student's t test). Mean percentage of transduced microglia exceeds 85% for each genotype (WT or Nox2-KO).
Figure 6.
Figure 6.
Both Nox1 and Nox2 promote microglial production of NO·. A, B, Cell production of NO· was determined by colorimetric measurement of nitrite levels in the medium of WT or Nox2-KO microglial cultures treated or not with LPS or LPS and apocynin for 16 h. A, Dots represent mean values in 15 WT and 13 Nox2-KO independent experiments (5–6 determinations in sister wells per experiment). Bold lines indicate the mean value calculated from the means of the independent experiments. B, For each genotype, data are mean ± SD of six determinations in sister wells from a representative experiment (*p < 0.01, SNK test). C, D, Real-time PCR determination of iNOS mRNA levels and Western blot detection of INOS protein in WT (C) or Nox2-KO (D) microglial cultures treated or not with LPS and/or DPI. iNOS mRNA levels were assessed in cells exposed 150 min to LPS with or without DPI and are expressed as percentage of the mean value in LPS-treated cultures; data are mean ± SD of three independent experiments with two determinations in sister wells per experiment. Images show Western blot detections of iNOS and β-actin in total protein extracts (7.5 μg/lane) of microglial cultures treated for 2–6 h with LPS in the absence or the presence of DPI. E, Microglial cultures transduced with lentiviral shNox1 or shCtrl were treated with LPS for 16 h before measurement of nitrite levels in the culture medium. For each genotype, nitrite levels are expressed as percentage of the mean value in shCtrl-transduced cultures. For each genotype (WT or Nox2-KO), data are mean ± SD of six determinations in sister wells from a representative experiment (*p < 0.001, Student's t test). Mean percentage of transduced microglia exceeds 85% for each genotype (WT or Nox2-KO).
Figure 7.
Figure 7.
Nox1 gene deletion reduces the level of tyrosine nitration without affecting recruitment of activated microglia in LPS-injected brain. Brains were fixed 4 d after intrastriatal injection of LPS. Top, Striatal sections in the vicinity of the injection site from WT and Nox1-KO mice double stained with rabbit polyclonal anti-Ntyr (green) and a combination of rat monoclonal anti-F4/80, anti-CD-68, and anti-CD11b antibodies that bind to microglial cells (Microglia, red). Scale bar, 100 μm. Bottom, High-power view (apotome) of a microglial cell body stained with anti-Ntyr. Hoechst staining of the nucleus (blue) is shown in the merge view. Scale bar, 10 μm.
Figure 8.
Figure 8.
Nox1 deletion prevents loss of synapsin in LPS-injected mouse striatum. A–C, Striatal fields from WT and Nox1-KO mice stained with rabbit polyclonal anti-Iba1 (microglial staining) (A), anti-GFAP (astrocyte staining) (B), or anti-synapsin (C) ipsilateral or contralateral to the lesional tract and localized 300 μm ventral to the injection site. Scale bars, 50 μm. D, Data represent the area of synapsin staining in ipsilateral striata normalized to the contralateral region for each genotype (mean ± SD from 5 animals of each genotype, *p < 0.01, Student's t test).

Similar articles

Cited by

References

    1. Allan SM, Tyrrell PJ, Rothwell NJ. Interleukin-1 and neuronal injury. Nat Rev Immunol. 2005;5:629–640. - PubMed
    1. Ambasta RK, Kumar P, Griendling KK, Schmidt HH, Busse R, Brandes RP. Direct interaction of the novel Nox proteins with p22phox is required for the formation of a functionally active NADPH oxidase. J Biol Chem. 2004;279:45935–45941. - PubMed
    1. Arai H, Furuya T, Yasuda T, Miura M, Mizuno Y, Mochizuki H. Neurotoxic effects of lipopolysaccharide on nigral dopaminergic neurons are mediated by microglial activation, interleukin-1beta, and expression of caspase-11 in mice. J Biol Chem. 2004;279:51647–51653. - PubMed
    1. Bánfi B, Clark RA, Steger K, Krause KH. Two novel proteins activate superoxide generation by the NADPH oxidase NOX1. J Biol Chem. 2003;278:3510–3513. - PubMed
    1. Bedard K, Krause KH. The NOX family of ROS-generating NADPH oxidases: physiology and pathophysiology. Physiol Rev. 2007;87:245–313. - PubMed

Publication types

MeSH terms

Substances