. 2008 Nov 12;28(46):12071-84.
doi: 10.1523/JNEUROSCI.2869-08.2008.

Contributions of the human temporoparietal junction and MT/V5+ to the timing of interception revealed by transcranial magnetic stimulation

Affiliations

Contributions of the human temporoparietal junction and MT/V5+ to the timing of interception revealed by transcranial magnetic stimulation

Gianfranco Bosco et al. J Neurosci. .

Abstract

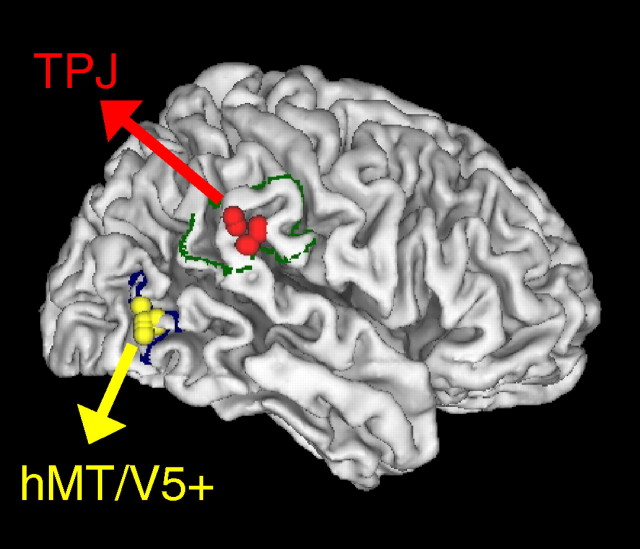
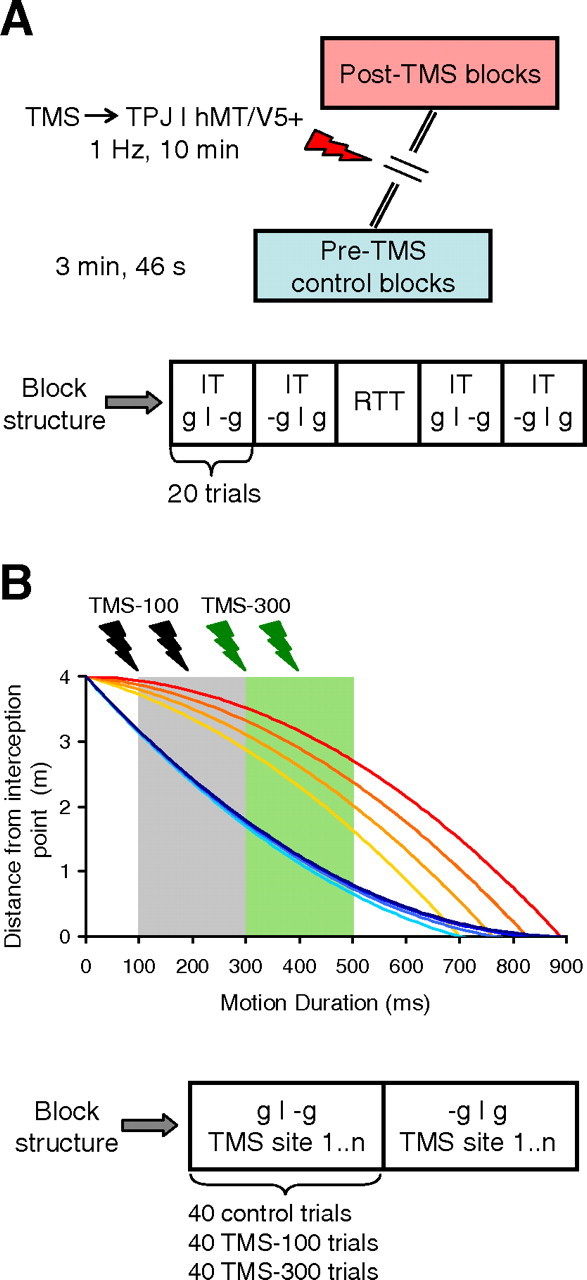
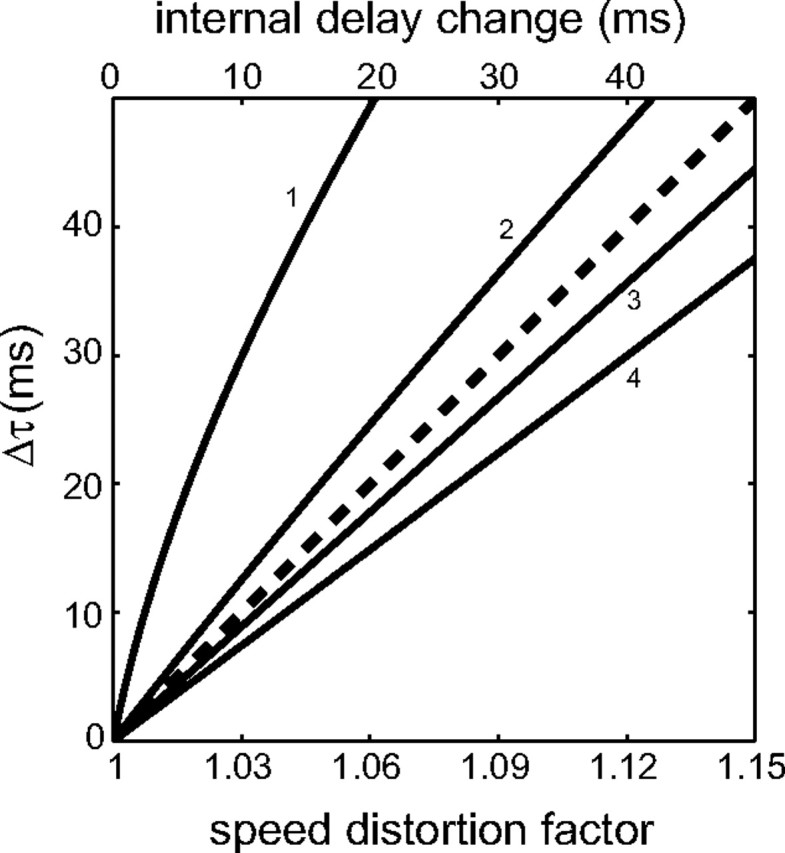
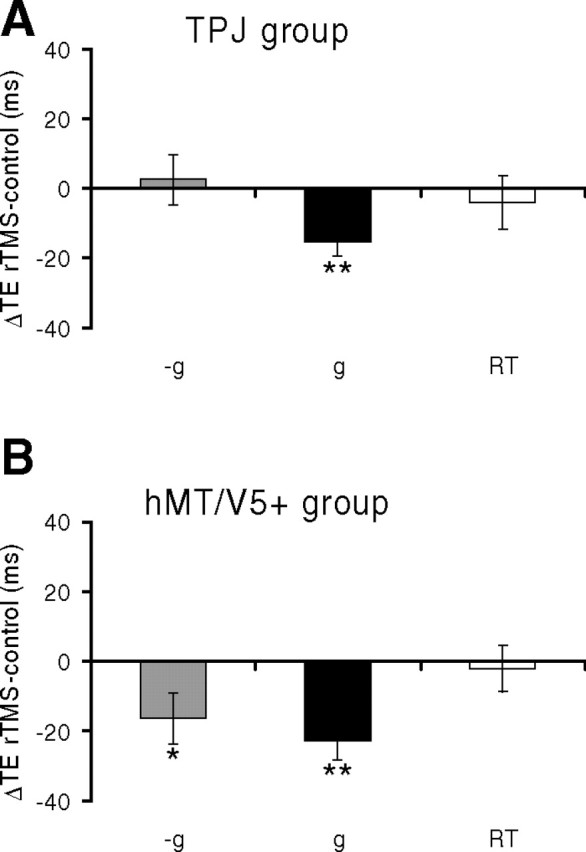
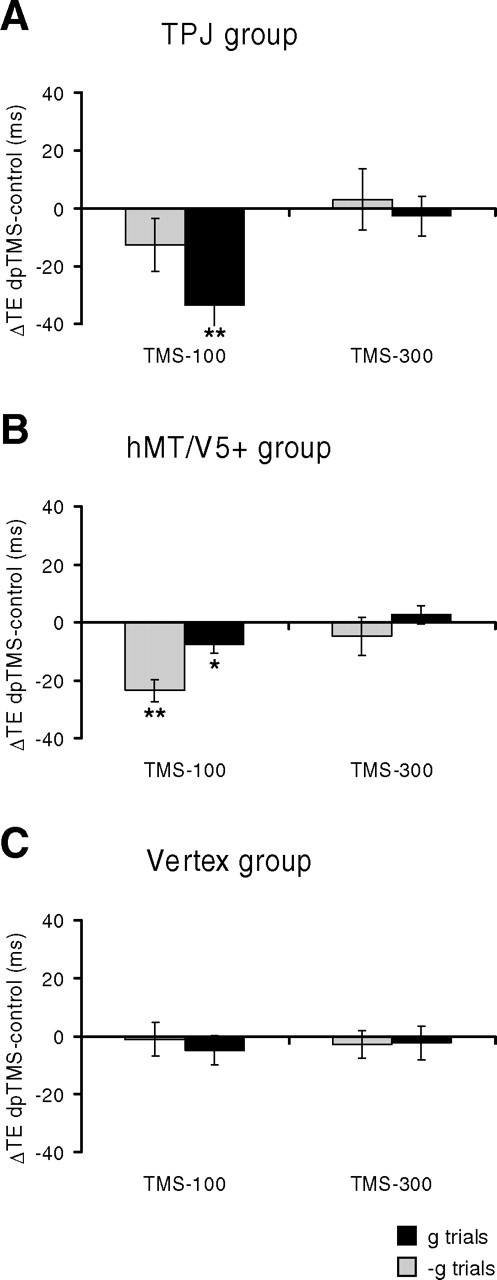
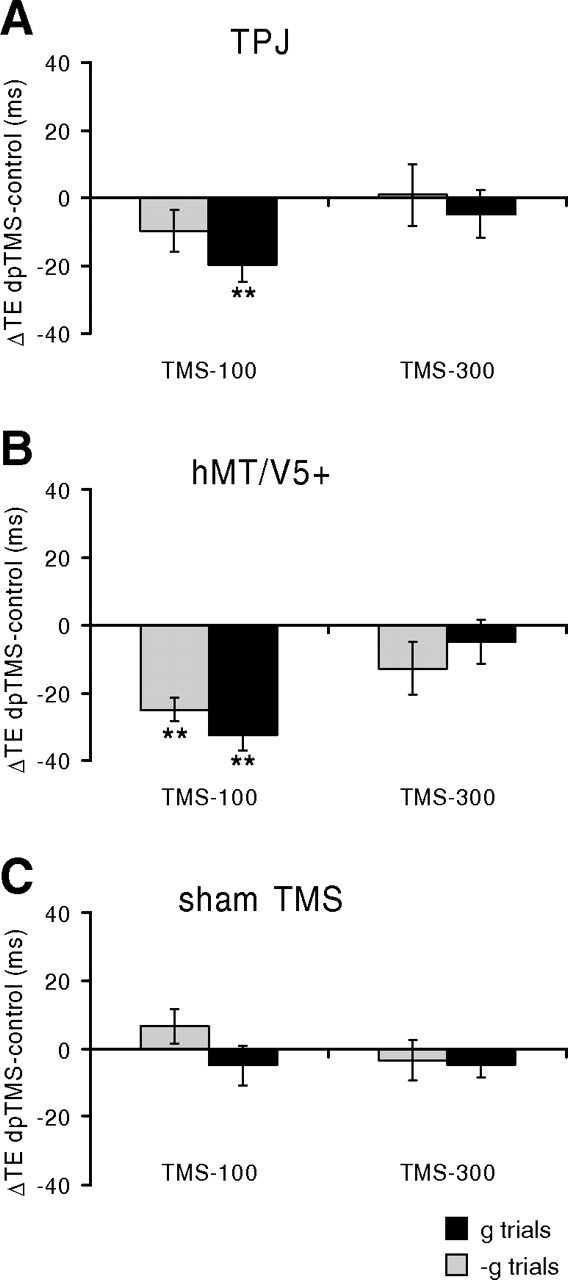
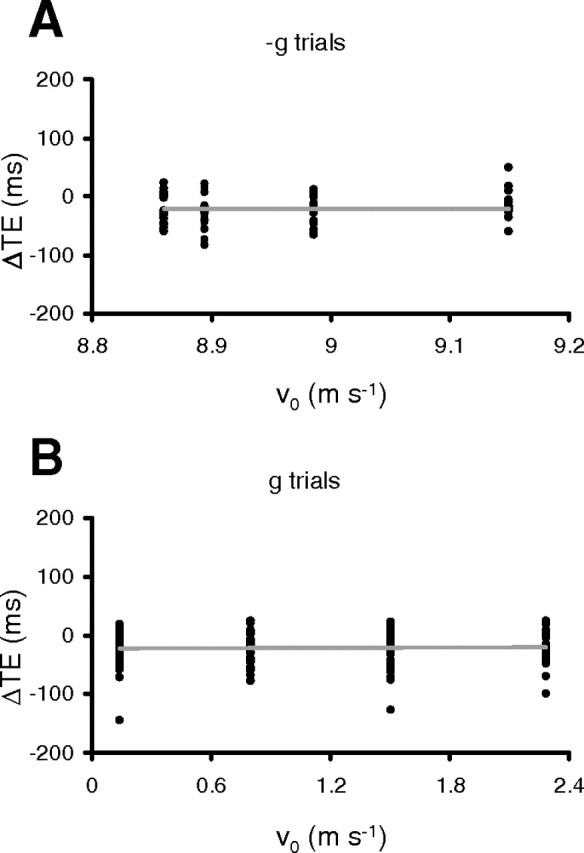
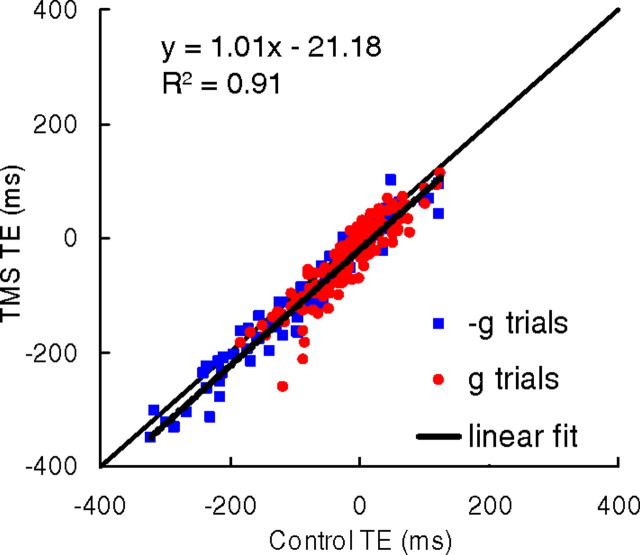
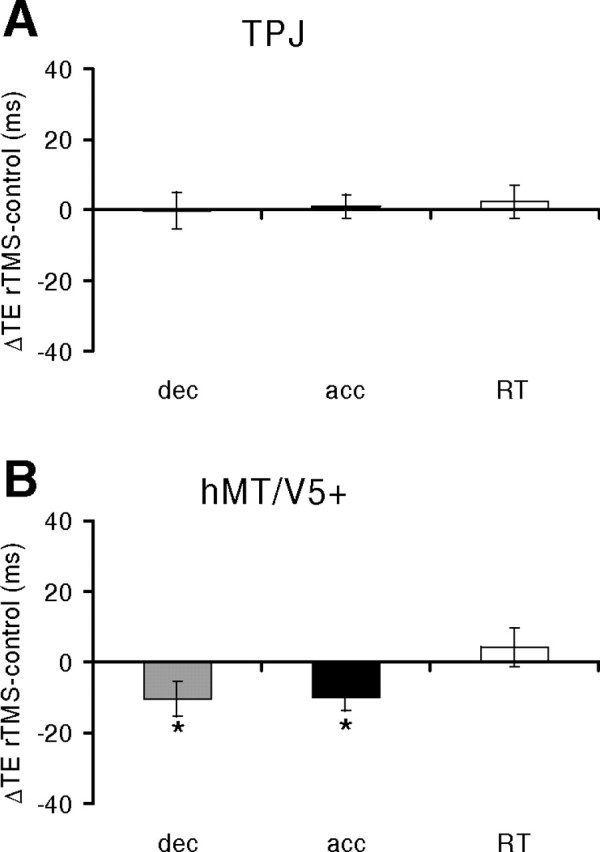
To intercept a fast target at destination, hand movements must be centrally triggered ahead of target arrival to compensate for neuromechanical delays. The role of visual-motion cortical areas is unclear. They likely feed downstream parietofrontal networks with signals reflecting target motion, but do they also contribute internal timing signals to trigger the motor response? We disrupted the activity of human temporoparietal junction (TPJ) and middle temporal area (hMT/V5+) by means of transcranial magnetic stimulation (TMS) while subjects pressed a button to intercept targets accelerated or decelerated in the vertical or horizontal direction. Target speed was randomized, making arrival time unpredictable across trials. We used either repetitive TMS (rTMS) before task execution or double-pulse TMS (dpTMS) during target motion. We found that after rTMS and dpTMS at 100-200 ms from motion onset, but not after dpTMS at 300-400 ms, the button-press responses occurred earlier than in the control, with time shifts independent of target speed. This suggests that activity in TPJ and hMT/V5+ can feed downstream regions not only with visual-motion information, but also with internal timing signals used for interception at destination. Moreover, we found that TMS of hMT/V5+ affected interception of all tested motion types, whereas TMS of TPJ significantly affected only interception of motion coherent with natural gravity. TPJ might specifically gate visual-motion information according to an internal model of the effects of gravity.


Figures

Figure 1.
Figure 1.
Stimulation sites. The contours of the target regions of interest are plotted (green TPJ, blue hMT/V5+) on a 3D rendering of the right hemisphere of the MNI brain template. The locations of the stimulation sites in the two groups of subjects of protocol 1 are shown for TPJ (red) and hMT/V5+ (yellow).
Figure 2.
Figure 2.
Experimental protocols. Block sequence and structure are shown for the low-frequency repetitive TMS (rTMS) experiments and double-pulse TMS (dpTMS) experiments in A and B, respectively. IT and RTT are miniblocks of interception trials and reaction-time trials, respectively. In B, dpTMS could be applied at either 100–200 ms (dpTMS-100) or 300–400 ms (dpTMS-300) after target motion onset, presumably interfering with cortical activity during the gray and green time window, respectively.
Figure 3.
Figure 3.
Simulations of TMS effects on interception timing. Continuous curves: predicted time shifts (Δτ, ordinates) of the TMS-perturbed responses relative to the control responses are plotted as a function of the distortion (sv) of the visual estimate of target speed (bottom abscissae) theoretically produced by TMS. Target speed is correctly estimated for sv = 1, whereas it is overestimated for sv > 1. Curves labeled 1–4 correspond to motion durations 890–700 ms, respectively. Dashed-line: predicted time shifts are plotted as a function of the change of internal time delays (top abscissae) theoretically produced by TMS. Here all the curves corresponding to the 4 different motion durations coincide exactly.
Figure 4.
Figure 4.
Interception of vertically moving targets (protocol 1). rTMS was applied over right TPJ (A) or hMT/V5+ (B). Bar graphs report mean differences (±SEM) of the timing errors (TE) between post-rTMS and pre-rTMS trials, pooled across all trials of all subjects. Negative (positive) values of ΔTE correspond to responses earlier (later) than the control responses. Gray: −g trials; black: g trials; white: RT trials. Statistically significant effects are indicated with asterisks: *p < 0.05; **p < 0.001 (repeated-measures ANOVA).
Figure 5.
Figure 5.
Results of protocol 2. dpTMS was applied over right TPJ (A), hMT/V5+ (B), or vertex (C). Bar graphs report mean differences (±SEM) of TE between either dpTMS-100 or dpTMS-300 trials and no-TMS control trials, pooled across all trials of all subjects. Other conventions as in Figure 4.
Figure 6.
Figure 6.
Results of protocol 3. dpTMS was applied over left TPJ (A) or hMT/V5+ (B), or sham-dpTMS was applied over left TPJ (C).
Figure 7.
Figure 7.
Relationships between TMS-induced time shifts (ΔTE) and initial target speed (which is uniquely related to MD for a given acceleration). Each data-point represents the mean ΔTE for a given subject, ball motion duration, and acceleration (A, −g trials; B, g trials). All experimental conditions that showed statistically significant TMS effects were considered.
Figure 8.
Figure 8.
Timing errors (TE) in TMS trials vs timing errors in control trials. Each point is the mean value (across all repetitions) of TE for a given subject, motion duration, trial type (g or −g), and protocol. Data (n = 216) correspond to all g trials with TMS on TPJ, all g and −g trials with TMS on hMT/V5+. Identity line (perturbed TE = control TE) and least-squares regression line across all data are plotted as thin and thick lines, respectively. Regression parameters are indicated in the inset.
Figure 9.
Figure 9.
Interception of horizontally moving targets (protocol 4). rTMS was applied over right TPJ (A) or hMT/V5+ (B). Same format as in Figure 4. Gray: Decelerated trials; black: accelerated trials; white: RT trials. *p < 0.05 (repeated-measures ANOVA).

References

    1. Anand S, Olson JD, Hotson JR. Tracing the timing of human analysis of motion and chromatic signals from occipital to temporo-parieto-occipital cortex: a transcranial magnetic stimulation study. Vision Res. 1998;38:2619–2627. - PubMed
    1. Barton JJ, Sharpe JA, Raymond JE. Directional defects in pursuit and motion perception in humans with unilateral cerebral lesions. Brain. 1996;119:1535–1550. - PubMed
    1. Beckers G, Zeki S. The consequences of inactivating areas V1 and V5 on visual motion perception. Brain. 1995;118:49–60. - PubMed
    1. Benguigui N, Ripoll H, Broderick MP. Time-to-contact estimation of accelerated stimuli is based on first-order information. J Exp Psychol Hum Percept Perform. 2003;29:1083–1101. - PubMed
    1. Born RT, Bradley DC. Structure and function of visual area MT. Annu Rev Neurosci. 2005;28:157–189. - PubMed

Publication types

MeSH terms

LinkOut - more resources