

doi: 10.1523/JNEUROSCI.2509-08.2008.
Microtubules in dendritic spine development
Affiliations
- PMID: 19005076
- PMCID: PMC2605155
- DOI: 10.1523/JNEUROSCI.2509-08.2008
Item in Clipboard
Microtubules in dendritic spine development
J Neurosci.
.
Abstract
It is generally believed that only the actin cytoskeleton resides in dendritic spines and controls spine morphology and plasticity. Here, we report that microtubules (MTs) are present in spines and that shRNA knockdown of the MT plus-end-binding protein EB3 significantly reduces spine formation. Furthermore, stabilization and inhibition of MTs by low doses of taxol and nocodazole enhance and impair spine formation elicited by BDNF (brain-derived neurotrophic factor), respectively. Therefore, MTs play an important role in the control and regulation of dendritic spine development and plasticity.
Figures
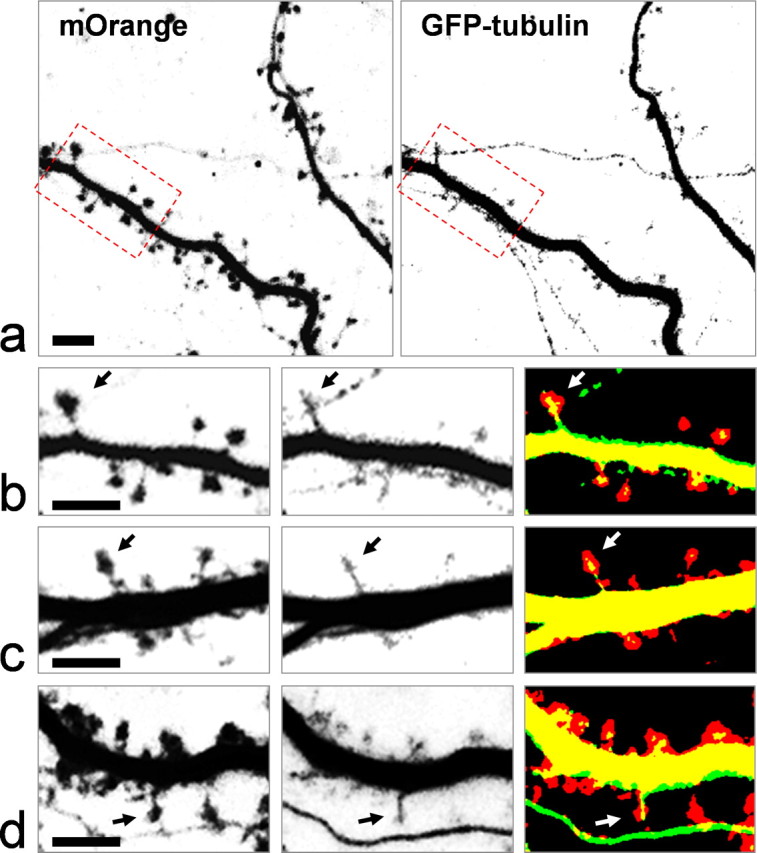
Confocal live imaging of dendritic spines and microtubules. Cultured hippocampal neurons were transfected with pmOrange and pEGFP-tubulin. Dual-channel imaging was achieved using the frame-channel acquisition mode to eliminate bleed through of two fluorophores. a, Representative images of the dendritic processes of a hippocampal neuron at DIV21. The spines are highlighted by mOrange fluorescence (left), and microtubules by GFP-tubulin (right). b, The region outlined by dashed rectangles is shown at higher magnification. Arrows indicate a mushroom-shaped spine that contains clear microtubules. c, d, Representative images of spines from different neurons showing the presence of MTs in spines. Scale bar, 5 μm.
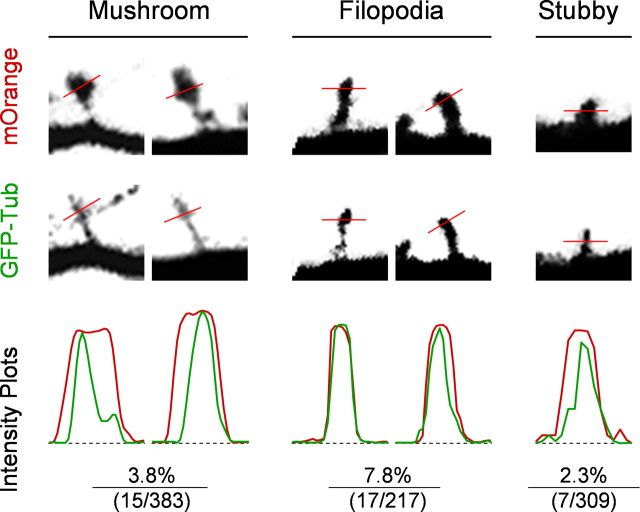
Intensity profile analyses of spines containing GFP-tubulin signals. Live confocal images of both mOrange and GFP-tubulin were subjected to line profile analyses. Dendritic spines were categorized into three groups: mushroom-shape, filopodia-like, and stubby. A line was drawn across the spine (at the widest part of spine for mushroom and filopodia spines, and at the halfway from dendrite to spine tip for stubby spines), and the intensity profiles of mOrange (red) and GFP (green) signals are shown. Only the mushroom-shaped spines exhibit a clear difference in the intensity profiles between the red and green channels, indicating that they likely contain microtubules rather than diffuse tubulin monomers and dimers. The percentages of each type of spines containing GFP-tubulin signals, together with the raw numbers (number containing GFP-tubulin/total number of spines), are shown. Data were collected from cultured hippocampal neurons (DIV21) from at least three independent groups of experiments.
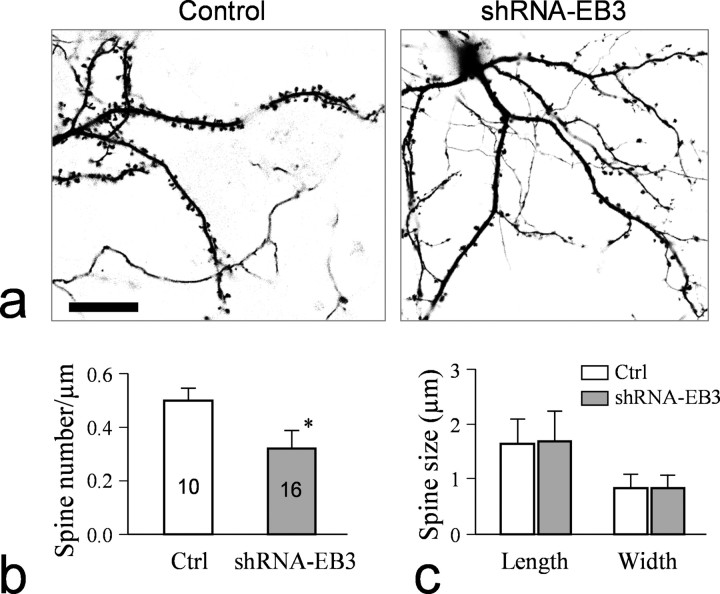
Knockdown of EB3 by shRNA reduces the number of dendritic spines. a, Representative images of dendritic processes and spines in a control neuron expressing GFP and a neuron coexpressing shRNA-EB3 and GFP. Scale bar, 20 μm. b, Quantification of the spine numbers for the control and shRNA-EB3 expressing neurons. Asterisk indicates a statistical significance (p < 0.05, Student's t test). c, Measurements of the spine size (width and length).
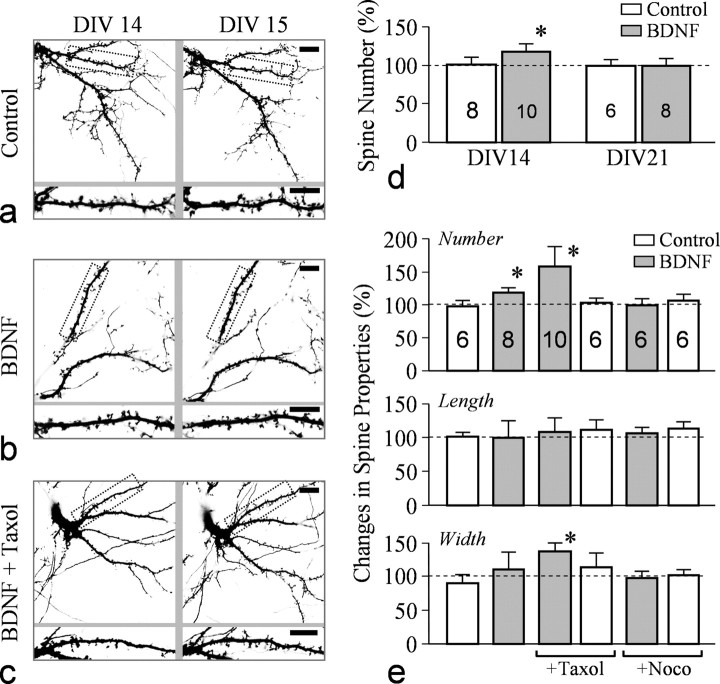
BDNF-elicited spine formation is enhanced by taxol. a, Representative images of dendritic processes and spines in a GFP-expressing neuron at DIV14 and DIV15. A portion of the dendrite (dotted rectangles) is enlarged to show spines (bottom row). b, Representative images showing the dendritic processes and spines of a neuron before and after 24 h exposure to BDNF. c, Representative images showing the dendritic processes and spines of a neuron before and after 24 h exposure to BDNF (50 ng/ml) and taxol (10 nm ). Scale bars: a–c, 10 μm. d, Quantitative analysis of the increase in spine numbers in control and BDNF-treated groups from DIV14 and DIV21 cultures. The asterisk indicates statistical significance when comparing the BDNF group to the control group (p < 0.05, Student's t test). e, Quantitative analysis of spine number, width, and length of neurons exposed to BDNF together with different MT-altering drugs. Nocodazole (Noco) was at 500 nm . Asterisks indicate statistical significance when compared with the control group (p < 0.05, Student's t test).
References
-
- Akhmanova A, Hoogenraad CC. Microtubule plus-end-tracking proteins: mechanisms and functions. Curr Opin Cell Biol. 2005;17:47–54. - PubMed
-
- Bacci A, Verderio C, Pravettoni E, Matteoli M. Synaptic and intrinsic mechanisms shape synchronous oscillations in hippocampal neurons in culture. Eur J Neurosci. 1999;11:389–397. - PubMed
-
- Banker GA, Cowan WM. Rat hippocampal neurons in dispersed cell culture. Brain Res. 1977;126:397–425. - PubMed
Publication types
MeSH terms
Substances
Grants and funding
LinkOut - more resources
Full Text Sources
Other Literature Sources