. 2008 Sep;4(9):e1000188.
doi: 10.1371/journal.pcbi.1000188. Epub 2008 Sep 26.

Cavities and atomic packing in protein structures and interfaces

Affiliations

Cavities and atomic packing in protein structures and interfaces

Shrihari Sonavane et al. PLoS Comput Biol. 2008 Sep.

Abstract

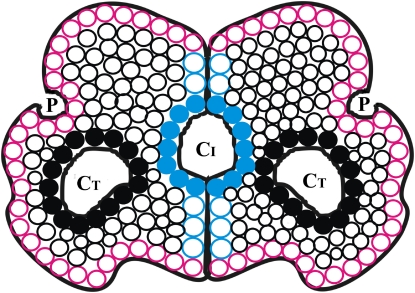
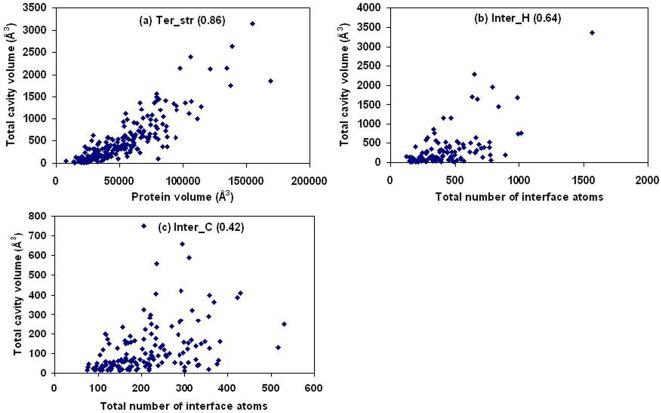
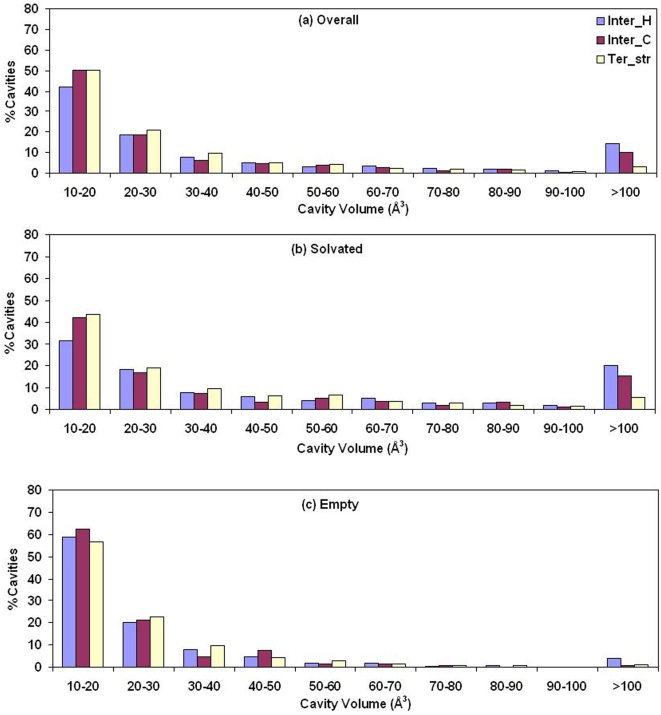
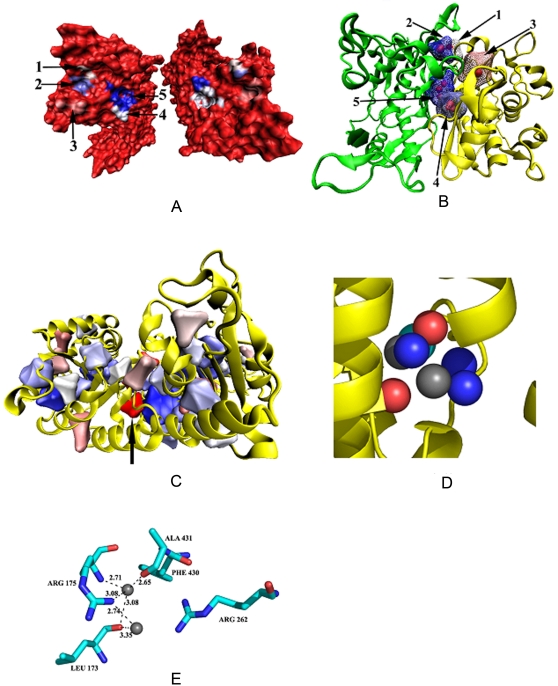
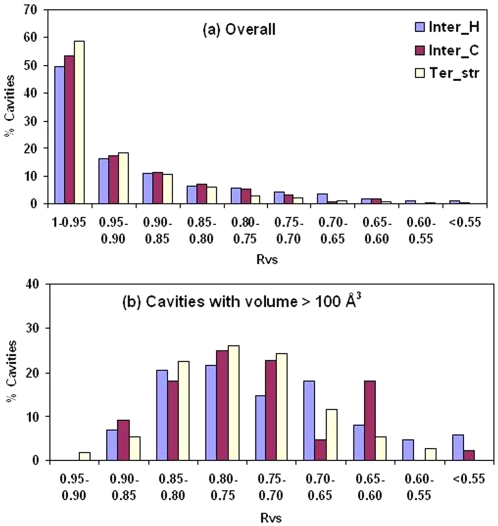
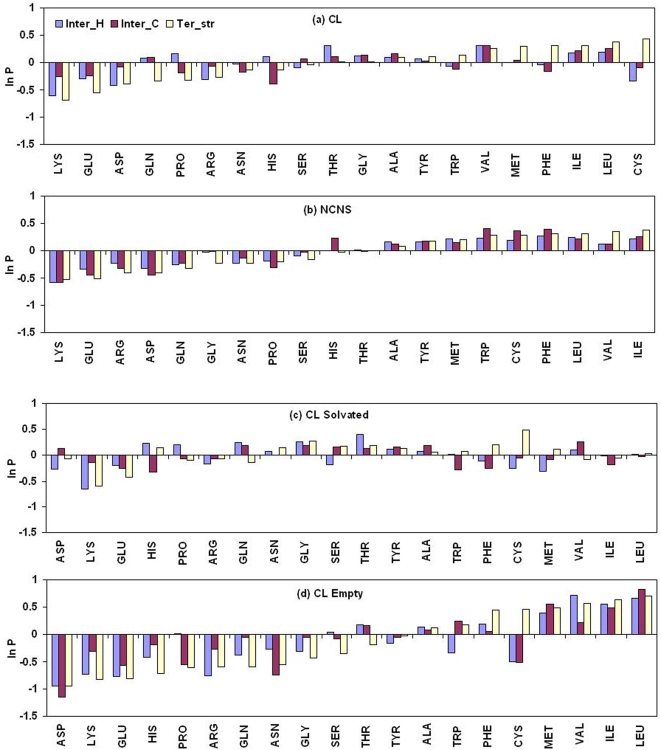
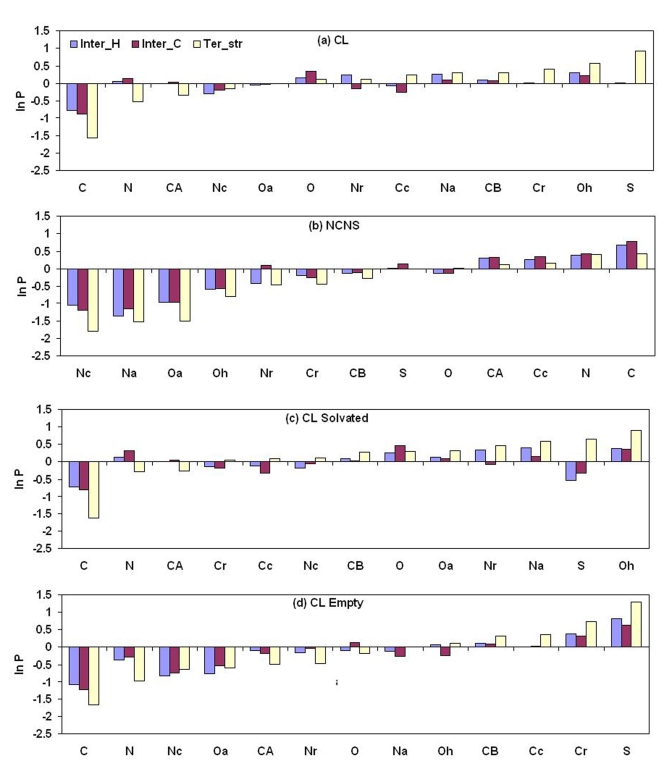
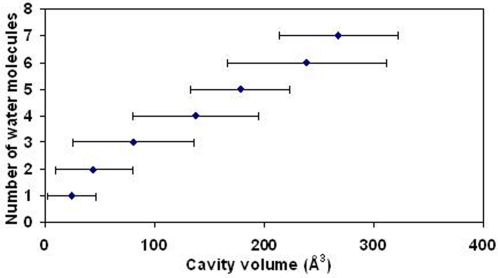
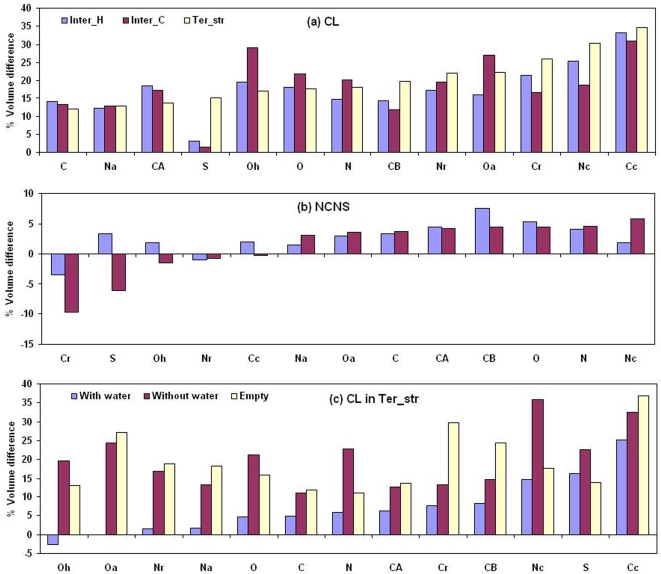
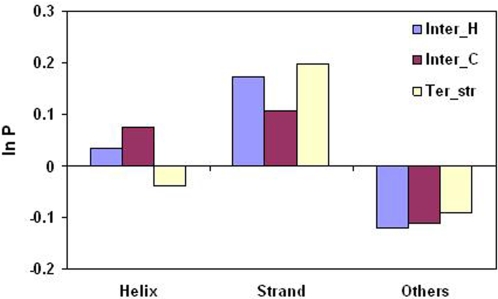
A comparative analysis of cavities enclosed in a tertiary structure of proteins and interfaces formed by the interaction of two protein subunits in obligate and non-obligate categories (represented by homodimeric molecules and heterocomplexes, respectively) is presented. The total volume of cavities increases with the size of the protein (or the interface), though the exact relationship may vary in different cases. Likewise, for individual cavities also there is quantitative dependence of the volume on the number of atoms (or residues) lining the cavity. The larger cavities tend to be less spherical, solvated, and the interfaces are enriched in these. On average 15 A(3) of cavity volume is found to accommodate single water, with another 40-45 A(3) needed for each additional solvent molecule. Polar atoms/residues have a higher propensity to line solvated cavities. Relative to the frequency of occurrence in the whole structure (or interface), residues in beta-strands are found more often lining the cavities, and those in turn and loop the least. Any depression in one chain not complemented by a protrusion in the other results in a cavity in the protein-protein interface. Through the use of the Voronoi volume, the packing of residues involved in protein-protein interaction has been compared to that in the protein interior. For a comparable number of atoms the interface has about twice the number of cavities relative to the tertiary structure.


Conflict of interest statement

The authors have declared that no competing interests exist.

Figures

Figure 1
Figure 1. Schematic representation of cavities in a homodimeric molecule.
Cavity-lining (CL) atoms are in filled circles, black for those in tertiary structures and blue in interfaces. Non-cavity-non-surface (NCNS) atoms in the tertiary structure are in open, black circles and those in the interface are in open, blue circles. Surface atoms are in red. Cavities within the tertiary structure (CT) and interface (CI) are distinct from the surface pockets (P).
Figure 2
Figure 2. Dependence of the total volume of cavities on the volume (or the total number of atoms) of the protein (or the interface).
Plot of total volume of cavities against (A) the volume of the protein tertiary structure, and (B,C) the total number of atoms in interfaces. The correlation coefficient, r, is given in parentheses. In (A) the equation for the least-squares line is y = 0.016x–311 (R 2 = 0.74); if approximated by a power law the corresponding equation is (A) y = 0.000002x 1.779 (R 2 = 0.70). If one uses the total number of atoms in the tertiary structure (in place of the volume) the distribution looks very similar to (A) and the two equations are y = 0.371x–279 (R 2 = 0.75) and y = 0.0009x 1.687 (R 2 = 0.71).
Figure 3
Figure 3. Distribution of the volume of cavities.
Histogram of the volume of cavities (A) all taken together, and separated into (B) solvated and (C) empty cavities.
Figure 4
Figure 4. Visualization of different features in some cavities.
(A) Surface representation of the structure with the PDB code, 1bkp, with five interface cavities. The two subunits are rotated about a vertical axis and taken apart to show how cavities are formed between them. (B) The cartoon representation of the secondary structures for the same protein as in (A), along with the maze representation of the cavities (with the enclosed water molecules in red). The individual cavities are labeled and their volume (Å3), number of water molecules and Rvs are as follows. 1: 12.3, 1, 0.99; 2: 13.3, 1, 0.99; 3: 31.7, 1, 0.75; 4: 110.5, 3, 0.84; and 5: 111.6, 3, 0.83. (C) Ter_str cavities within one subunit of the dimeric molecule, 1dpg. One of the cavities (pointed by an arrow, volume: 20.7 Å3 and Rvs: 0.92) with two water molecules is shown in (D) along with the CL atoms, and all the hydrogen bonds are given in (E). Diagrams (C–E) do not have the molecules in the same orientation. In (D) and (E) the water molecules are in grey.
Figure 5
Figure 5. Distribution of Rvs.
Histogram of Rvs for (A) all the cavities and (B) cavities with volume>100 Å3.
Figure 6
Figure 6. Propensities of residues to be associated with cavities.
Propensities of different types of residues in (A) cavity-lining and (B) non-cavity-non-surface regions, and in the cavity-lining region of (C) solvated and (D) empty cavities in protein structures and interfaces.
Figure 7
Figure 7. Propensities of atoms to be associated with cavities.
Propensities of different types of atoms in (A) cavity-lining and (B) non-cavity-non-surface regions, and in the cavity-lining region of (C) solvated and (D) empty cavities in protein structures and interfaces. The atom types have been defined in Methods.
Figure 8
Figure 8. Plot of the number of water molecules present in a cavity against its volume (Å3).
For a given value along the y axis the average of all the values along the x axis is shown (the horizontal bars representing the standard deviations). The numbers of points used for averaging are 948, 321, 83, 26, 10, 5 and 3 (six cavities have >7 water molecules). The equation for the least-squares line is y = 0.023x+0.70 (R 2 = 0.99).
Figure 9
Figure 9. Change in the Voronoi volumes of atoms in cavities.
Change in the Voronoi volumes (relative to those in the NCNS region of tertiary structure) of (A) CL atoms, (B) NCNS in interface, and (C) CL atoms in empty and solvated Ter_str cavities. For the solvated cavities in (C) the calculation has been done twice, once including the coordinates of the water molecules and the other excluding.
Figure 10
Figure 10. Propensity of cavity lining atoms to occur in different secondary structural elements.
Figure 11
Figure 11. An example of a cavity involving β-sheets.
The second largest cavity (with a volume of 222.4 Å3 and Rvs of 0.75) in the structure of 4htc, located in the interface, involving β-sheets. Of the 32 CL atoms, 4 are from helix, 14 from β-strands and 14 belong to ‘Others’.
Figure 12
Figure 12. Some examples of cavities with water molecules, cation and ligand.
The largest interface cavity (containing 56 water molecules, with a total volume of 2341 Å3 and Rvs of 0.5), in the homodimeric structure of 1oac is displayed in (A). Cavities with a large water content are also observed in dimeric interfaces: 1mor (46, 2202 Å3 and 0.5), 1chm (58, 1798 Å3, 0.3). PDB codes for cavities containing 10–20 water molecules are Ter_str (1cmb); Inter_H (1ade, 1b8j, 1bis, 1chm, 1mkb (2 cases), 1mor, 1oac, 1sox, 1utg and 5rub); Inter_C (1kz7). (B) shows a Ca2+ ion and a water (red) molecule in a cavity (volume: 17.2 Å3 and Rvs: 0.96) of 2scp. (C) shows α-d-glucose-6-phosphate and nine water molecules in a cavity (565.1 Å3 and 0.69) of 1mor.

Similar articles

Cited by

References

    1. Richards FM. Areas, volumes, packing and protein structure. Annu Rev Biophys Bioeng. 1977;6:151–176. - PubMed
    1. Richards FM. The interpretation of protein structures: total volume, group volume distributions and packing density. J Mol Biol. 1974;82:1–14. - PubMed
    1. Gerstein M, Sonnhammer EL, Chothia C. Volume changes in protein evolution. J Mol Biol. 1994;236:1067–1078. - PubMed
    1. Fleming PJ, Richards FM. Protein packing: dependence on protein size, secondary structure and amino acid composition. J Mol Biol. 2000;299:487–498. - PubMed
    1. Connolly ML. Atomic size packing defects in proteins. Int J Pept Protein Res. 1986;28:360–363. - PubMed

Publication types