

Review
doi: 10.1021/cr8004422.
Biomimetic systems for hydroxyapatite mineralization inspired by bone and enamel
Affiliations
- PMID: 19006400
- PMCID: PMC2593885
- DOI: 10.1021/cr8004422
Item in Clipboard
Review
Biomimetic systems for hydroxyapatite mineralization inspired by bone and enamel
Chem Rev.
2008 Nov.
No abstract available
Figures
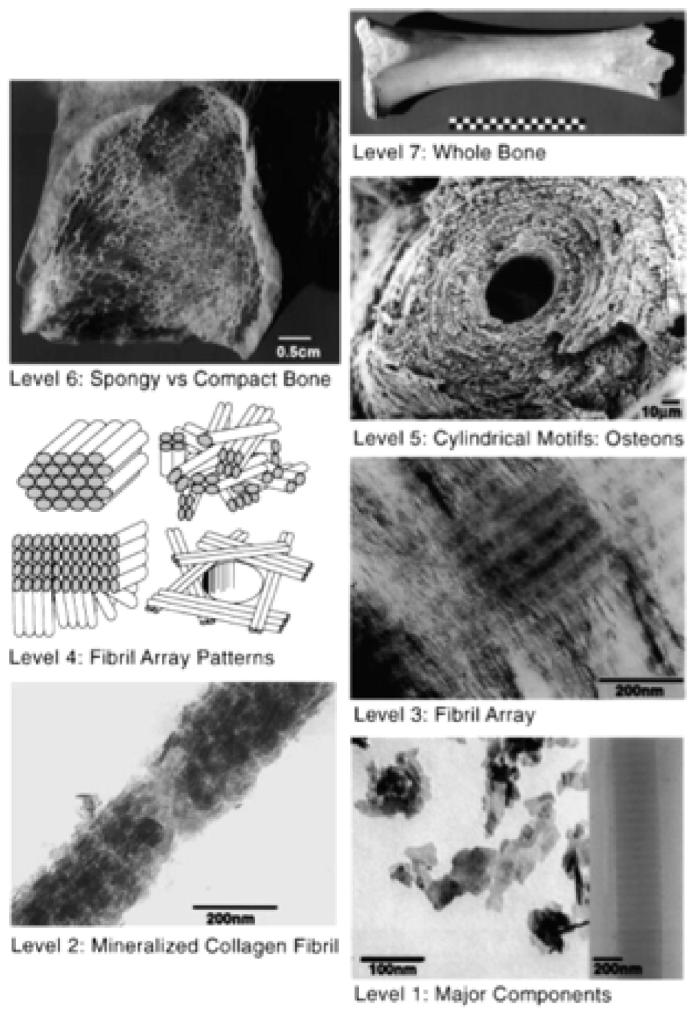
Seven hierarchical levels of organization of the bone family of materials as proposed by Weiner and Wagner. Reprinted with permission from Ann. Rev. Mater. Sci., ref . Copyright 1998 Annual Reviews (http://www.annualreviews.org ).
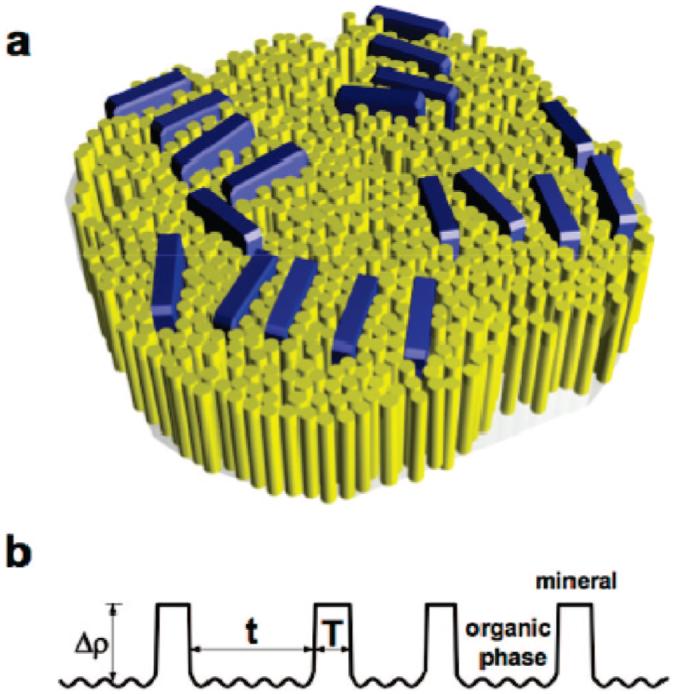
(a) Schematic illustration of the lateral packing of mineral crystals in the collagen matrix. Thin apatite platelets are aligned nearly parallel within the stacks. The crystals are typically about 2 nm thick, 20 nm wide, and 30 nm high. (b) Map of the electron density projected onto the normal of a stack of mineral platelets. T is the thickness of individual crystals, and t is the thickness of organic layers between the neighboring crystals. The density of the mineral phase is assumed to be uniform, but there are small density fluctuations in the organic phase that are much smaller than the density contrast (Δρ) between the mineral and the organic phases. Reprinted with permission from Biophys. J., ref . Copyright 2008 Biophysical Society.
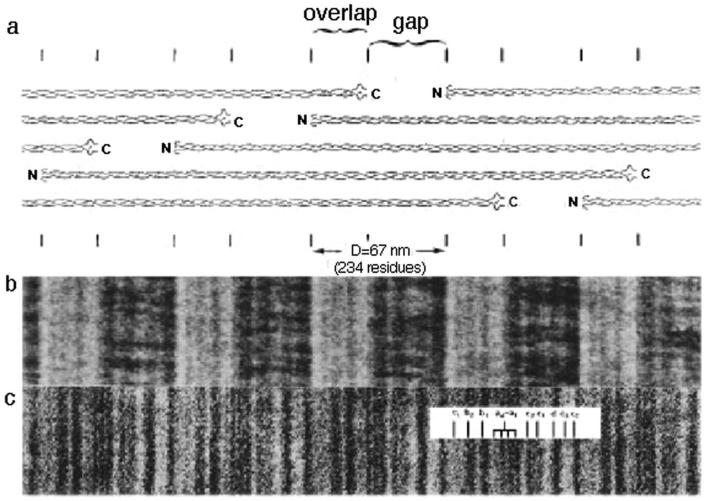
Axial structure of D-periodic collagen fibrils. (a) Schematic representation of the axial packing arrangement of triple-helical collagen molecules in a fibril, as derived from analysis of the negative (b) and positive (c) staining patterns. (b) Collagen fibril negatively stained with sodium phosphotungstic acid (1%, pH 7). The fibril is from a gel of fibrils reconstituted from acetic acid-soluble calfskin collagen. The repeating broad dark and light zones are produced by preferential stain penetration into regions of lowest packing (the gap regions). (c) Similar fibril positively stained with phosphotungstic acid (1%, pH 3.4) and then uranyl acetate (1%, pH 4.2). The darkly staining transverse bands are the result of uptake of electron dense heavy-metal ions from the staining solutions onto charged residue side groups of collagen. Reprinted with permission from Biochem. J., ref . Copyright 1996 Portland Press.
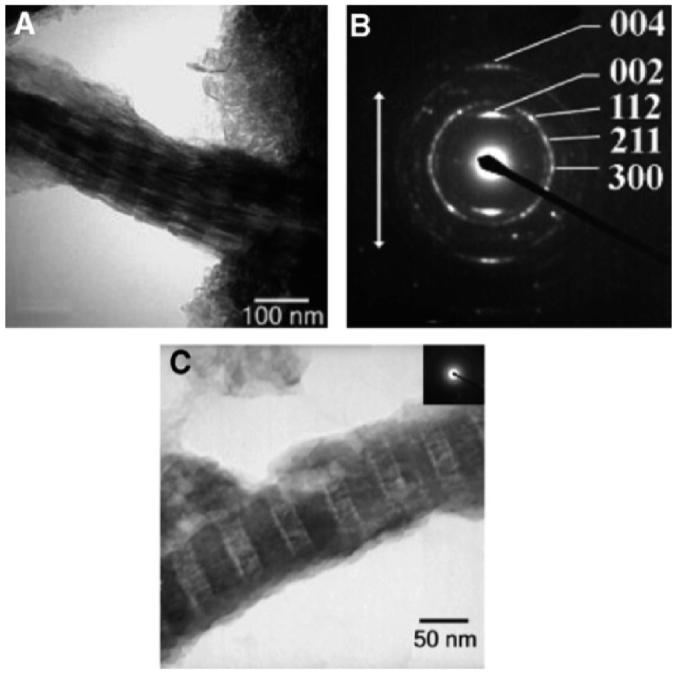
Electron micrographs of equine cortical bone. (A) TEM brightfield image demonstrating intrafibrillar mineralization of type I collagen fibrils in natural bone. The native banding pattern of type I collagen is due to the infiltration of electron dense mineral, and staining was therefore unnecessary. The striated appearance results from HA platelets aligned parallel to the long axis of the collagen. Scale bar = 100 nm. (B) Selected area electron diffraction (SAED) of a single fibril of crushed equine bone. The arcing of the (002) and (004) planes, which are parallel to the long axis of the collagen fibrils (white arrow), is characteristic of bone. The (112), (211), and (300) planes, indexed using d-spacings and angles relative to the (002) plane, form three arcs that nearly overlap, combining into what appears to be a ring; however, there is a gap in the ring just behind the (002) arc because it is not really a powder ring but three distinct sets of planes that have very close d-spacings. The appearance of these three planes simultaneously indicates that there is more than one orientation of the HA platelets in the a-b plane. (C) TEM brightfield image of an isolated collagen fibril showing the banding pattern of that is characteristic of type I collagen. The SAED pattern (inset) of this fibril demonstrates that the fibril does not diffract, suggesting that the electron dense phase, which is the only thing providing contrast (the sample was not stained), is amorphous CaP. Scale bar = 50 nm. Reprinted with permission from Mater. Sci. Eng., R, ref . Copyright 2007 Elsevier.
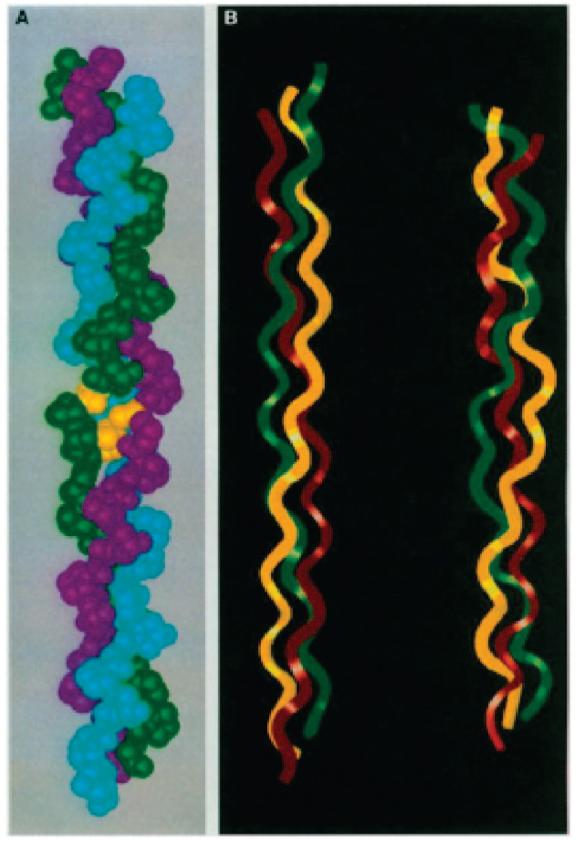
(a) Space-filling model of Gly→Ala collagen crystal structure and (b) ribbon diagram comparison of native collagen 107 helix (left) and the Gly→Ala peptide (right). Reprinted with permission from Science (http://www.sciencemag.org ), ref . Copyright 1994 AAAS.
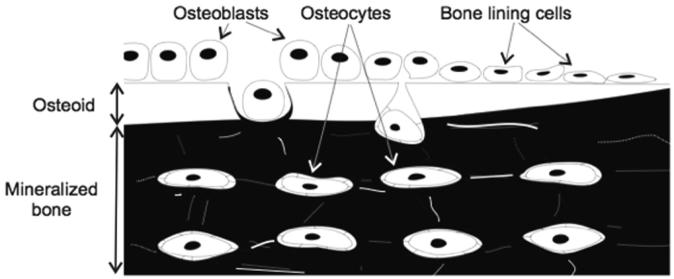
Schematic of the topographic relationship among bone cells. The osteoblasts are located on the lining layer of bone surface, actively producing uncalcified matrix (osteoid tissue). Osteocytes are the most mature or terminally differentiated cells of the osteoblast lineage and are embedded in the bone matrix. Reprinted with permission from Acta Biochim. Pol., ref . Copyright 2003 Acta Biochim. Pol.
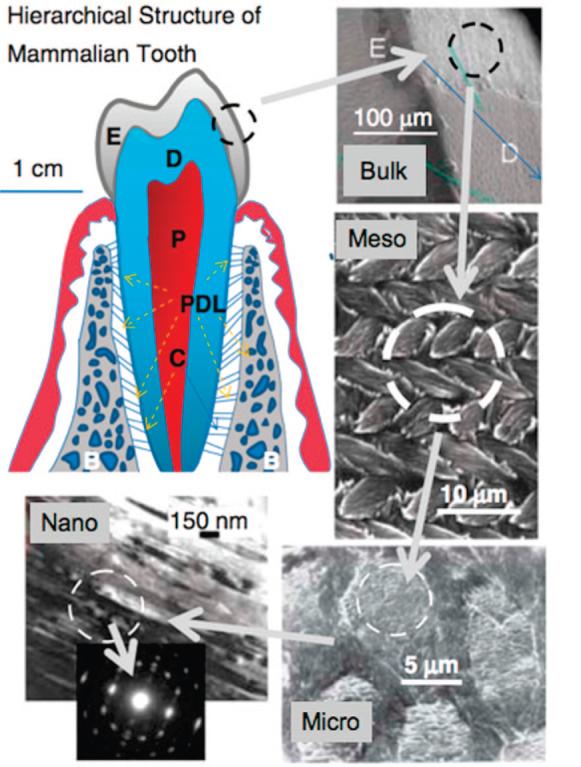
Hierarchical architecture of mammalian enamel. Enamel (E) is the outermost layer at the crown of the tooth and resides above the dentin (D). The pulp (P) contains nerves and blood vessels, while the cementum (C) is the outermost layer of mineralized tissue surrounding the root of the tooth allowing the tooth to be anchored to the jawbone through the periodontal ligament (PDL). The bulk image depicts the enamel organ, the transition across the dentino-enamel junction, and the dentin below. On the mesoscale level, prismatic enamel consisting of weaving of rods (or prisms) that range from 3 to 5 μm in diameter can be visualized. Upon further magnification, the micrometer scale shows the composition of a single rod. The nanometer scale reveals a highly organized array of individual HA crystallites (approximately 30 nm thick, 60 nm wide, and several millimeters in length), which are preferentially aligned along the c-axis. Adapted with permission from MRS Bull., ref . Copyright 2008 Materials Research Society (www.mrs.org/bulletin ).
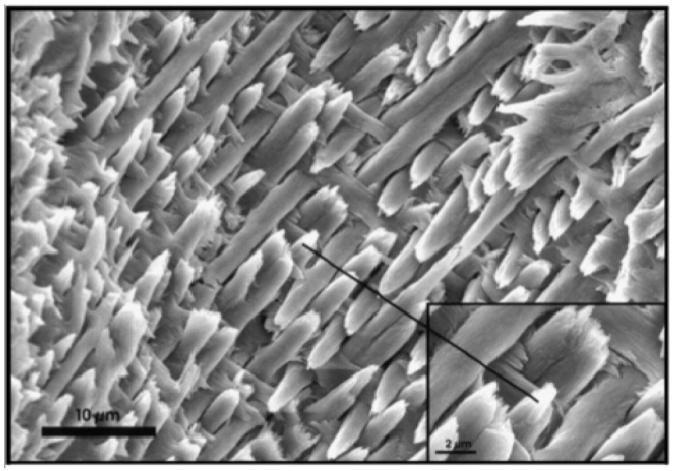
Organization of prismatic dental enamel on the mesoscale showing interweaving crystallite bundles termed as prisms or rods. This scanning electron micrograph shows an acid-etched ground section of mature mouse incisal dental enamel. Reprinted with permission from J. Struct. Biol., ref . Copyright 1999 Elsevier.
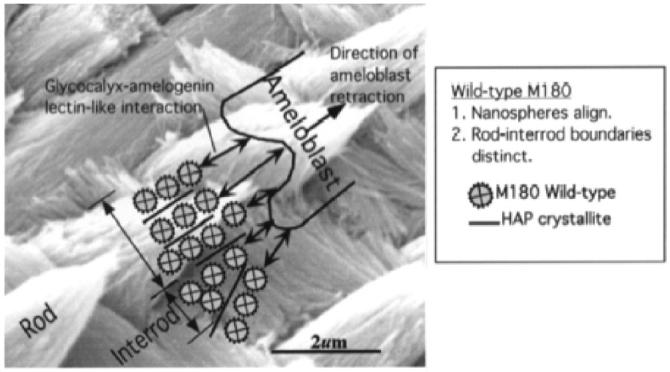
Organization of prismatic dental enamel on the mesoscale showing interweaving crystallite bundles termed as prisms or rods. This scanning electron micrograph shows an acid-etched and ground section of mature mouse incisal dental enamel. Reprinted with permission from J. Struct. Biol., ref . Copyright 1999 Elsevier.
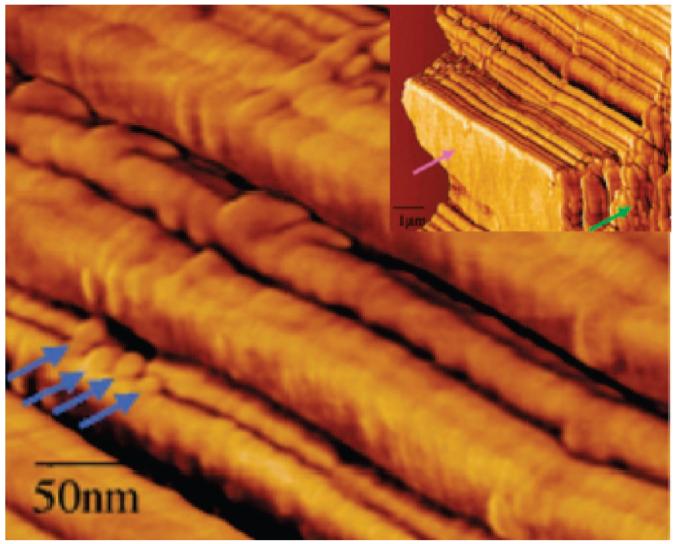
Amelogenin nanospheres aligned in a “chain” of porcine enamel aligned along the side of enamel crystallite imaged via AFM. The purple arrow indicates the 100 face of enamel, the green arrow indicates organic, and the blue arrows indicate the nanospheres. Reprinted with permission from Matrix Biol., ref . Copyright 2001 Elsevier.
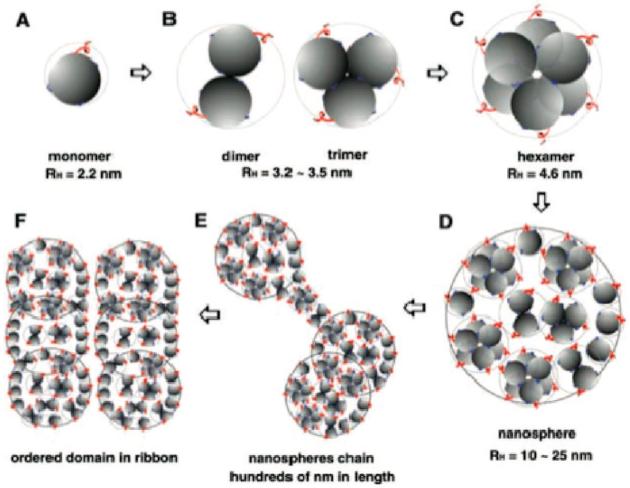
Schematic model of amelogenin self-assembly based on DLS analysis, TEM, SEM, and AFM observations. (A) The amelogenin molecule folds into a globular form that preserves the bipolar nature derived from the protein’s primary structure. The hydrophilic C-terminal (-Thr-Lys-Arg-Glu-Glu-Val-Asp) “tail” (red thread) is flexible and exposed on the surface of otherwise hydrophobic molecule. (B and C) Hydrophobic interactions drive oligomerization of the amelogenin into higher order aggregates. The apparent radii for the ideal hard sphere type of oligomers are calculated to be 3.5 nm for a dimer or a trimer and 4.2 nm for a hexamer. (D) Nanosphere structures form by further association of the monomers and oligomers. (E) The nanospheres can then assemble linear chains of 10-15 nanospheres. In water, this process was facilitated by increasing amelogenin concentration or adding a hydrophilic ingredient such as PEG. (F) The bipolar nature of the amelogenin can facilitate the formation and/or the reorganization of the chain structures and eventually to a ribbon structure. Reprinted with permission from Science (http://www.sciencemag.org ), ref . Copyright 2005 AAAS.
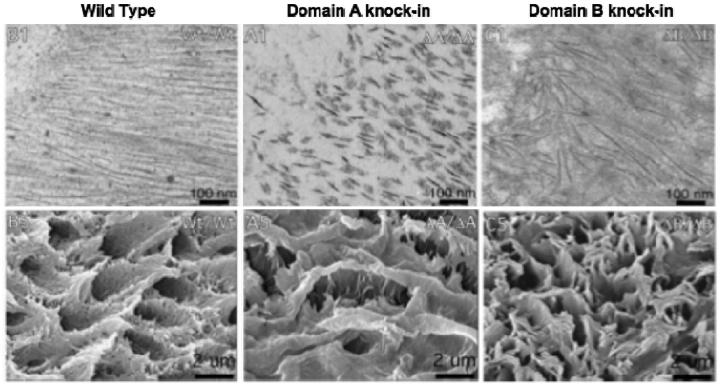
Row 1: TEM images of new enamel crystallites of wild-type, knock-in self-assembly Domain A knock-in and knock-in self-assembly Domain B knock-in mice. Shorter crystallites can be seen with knock-in A and disruption of the enamel pattern due to collapse of amelogenin nanospheres can be seen in the knock-in B. Row 2: Magnified SEM images of resulting crystallites of wild-type, knock-in A, and knock-in B. Knock-in A exhibits short and enlarged crystallites, while knock-in B exhibits numerous but smaller crystallites as compared to wild-type. Reprinted with permission from J. Biol. Chem., ref . Copyright 2006 American Society for Biochemistry and Molecular Biology.
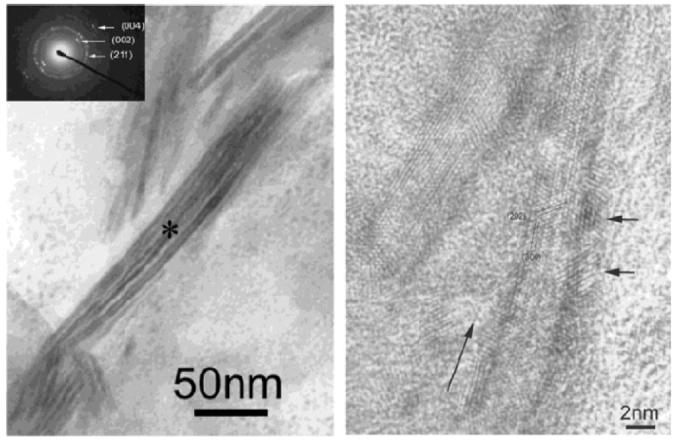
(a) High magnification of the mineralized collagen fibrils. The insert is the selected area electron diffraction pattern of the mineralized collagen fibrils. The asterisk is the center of the area, and the diameter of the area is about 200 nm. (b) HR-TEM image of mineralized collagen fibrils. The long arrow indicates the longitude direction of collagen fibril. Two short arrows indicate two HA nanocrystals. Reprinted with permission from ref . Copyright 2003 American Chemical Society.
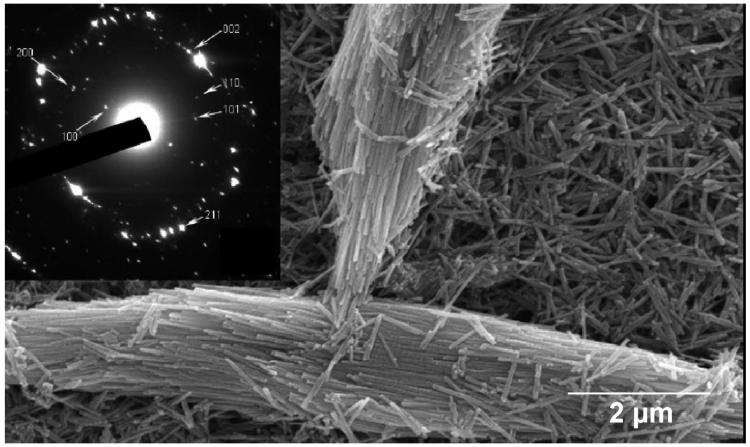
SEM image of rat enamel prisms and enamel crystals. (Inset) SAED pattern of enamel crystals. Lattice planes are indicated in the pattern by arrows. Reprinted with permission from J. Colloid Interface Sci., ref . Copyright 2005 Elsevier.
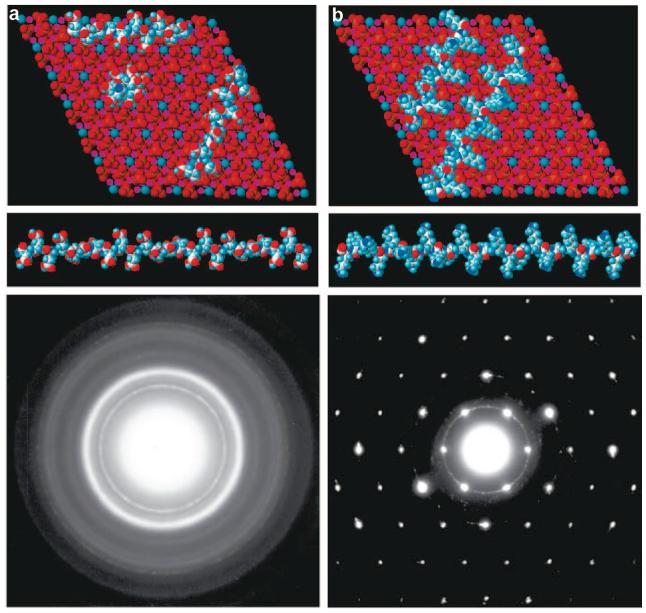
In synthetic OAs, very small amounts of poly(amino acids) can manipulate microstructure by forming either (a) polycrystalline aggregates of apatite nanocrystals with poly(l -glutamic acid) or (b) large, flat single crystals (micrometers in cross-section and nanometers in thickness), or poly(l -lysine) is present in the mother liquor. Note the coherence between the apatite crystal lattice and the amino groups of the poly(l -lysine) chain in part b. Reprinted with permission from Science (http://www.sciencemag.org ), ref . Copyright 1997 AAAS.
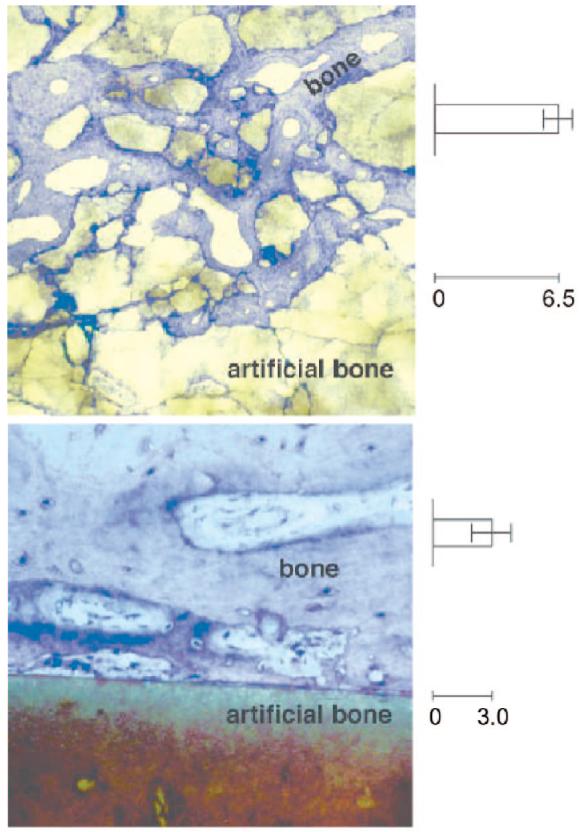
Brittleness of an apatite-based artificial bone material is revealed by the common fragmentation of cylindrical objects implanted in bone (top), whereas mechanically toughened implants can be synthesized by manipulation of the mineral’s growth and particle sintering with only 2-3 weight % organic macromolecules (bottom). The fragmentation index is given on the right-hand side of each figure. Reprinted with permission from Science (http://www.sciencemag.org ), ref . Copyright 1997 AAAS.
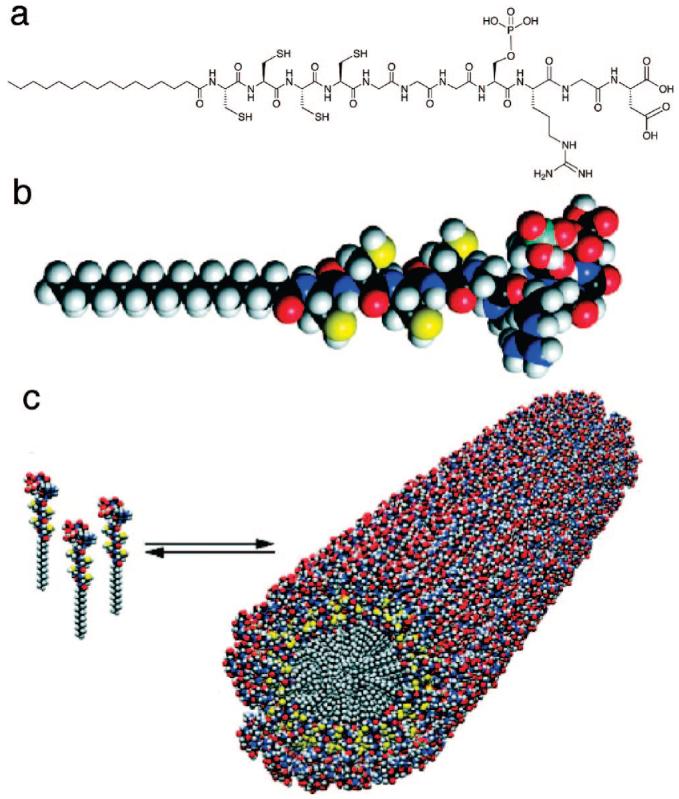
(a) Chemical structure of the PA, consisting of a hydrophobic alkyl tail; four cysteine residues that when oxidized may form disulfide bonds to polymerize the self-assembled structure; a flexible linker region of three glycine residues to provide the hydrophilic head group flexibility from the more rigid cross-linked region; a single phosphorylated serine residue that was designed to interact strongly with calcium ions and help direct mineralization of HA; and the cell adhesion ligand RGD. (b) Molecular model of the PA showing the overall conical shape of the molecule going from the narrow hydrophobic tail to the bulkier peptide region. (c) Schematic showing the self-assembly of PA molecules into a cylindrical micelle. Reprinted with permission from Science (http://www.sciencemag.org ), ref . Copyright 2001 AAAS.
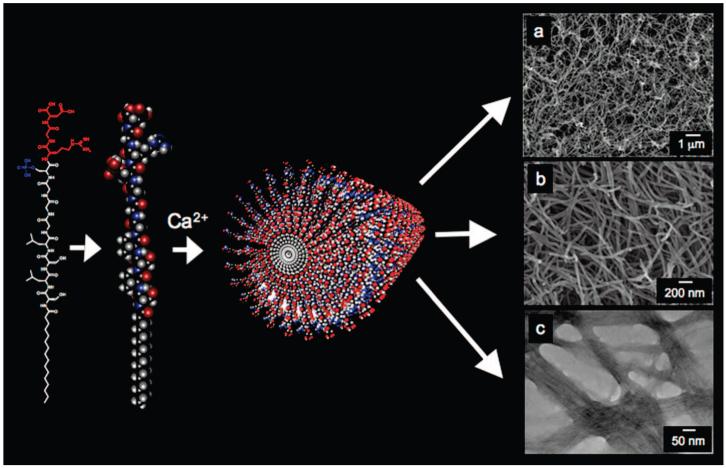
Schematic illustration of the RGD-PA and its self-assembly into a nanofiber. The low magnification (a) and high magnification (b) scanning electron micrographs and the transmission electron micrograph (c) show fibrous bundles, made up of PA nanofibers approximately 5-7 nm in diameter. The scanning electron micrographs were taken of a critical point dried PA gel, while the transmission electron micrograph was taken of nanofibers dried on a TEM grid and stained with phosphotungstic acid.
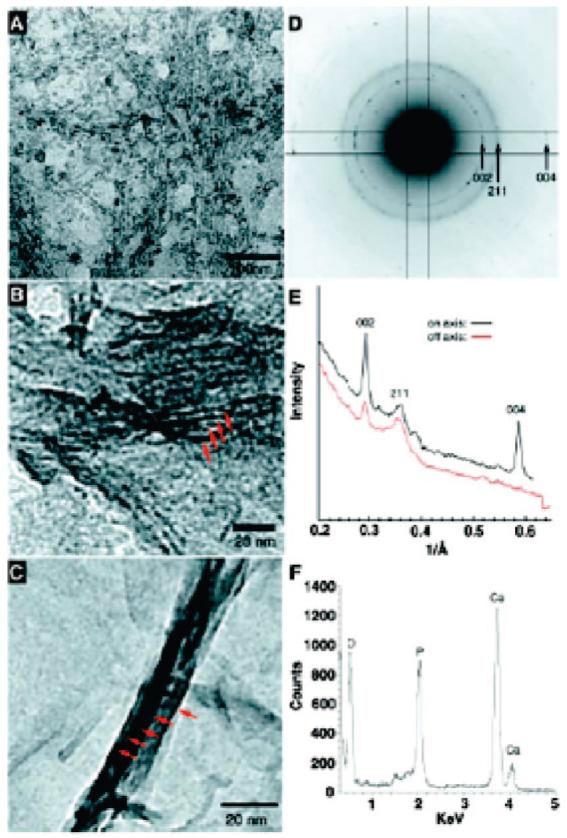
(a) TEM micrographs of the unstained, cross-linked peptide-amphiphile fibers incubated for 10 min in CaCl2 and Na2HPO4 solution. (b) After 20 min, forming HA crystals (red arrows) are observed in parallel arrays on some of the PA fibers. (c) After 30 min, mature HA crystals (red arrows) completely cover the PA fibers. (d) Electron diffraction pattern taken from a mineralized bundle of PA fibers after 30 min of exposure to calcium and phosphate. The presence and orientation of the diffraction arcs corresponding to the 002 and 004 planes (whose intensities are enhanced with respect to the 211 family of reflections) indicate preferential alignment of the crystals with their c-axes along the long axis of the bundle. (e) Plot of intensity vs inverse angstroms reveals that the 002 and 004 peaks of HA are strongly enhanced along the peptide-amphiphile fiber axis. (f) EDS profile of mineral crystals after 30 min of incubation reveals a Ca/P ratio of 1.67 ± 0.08, as expected for HA. Reprinted with permission from Science (http://www.sciencemag.org ), ref . Copyright 2001 AAAS.
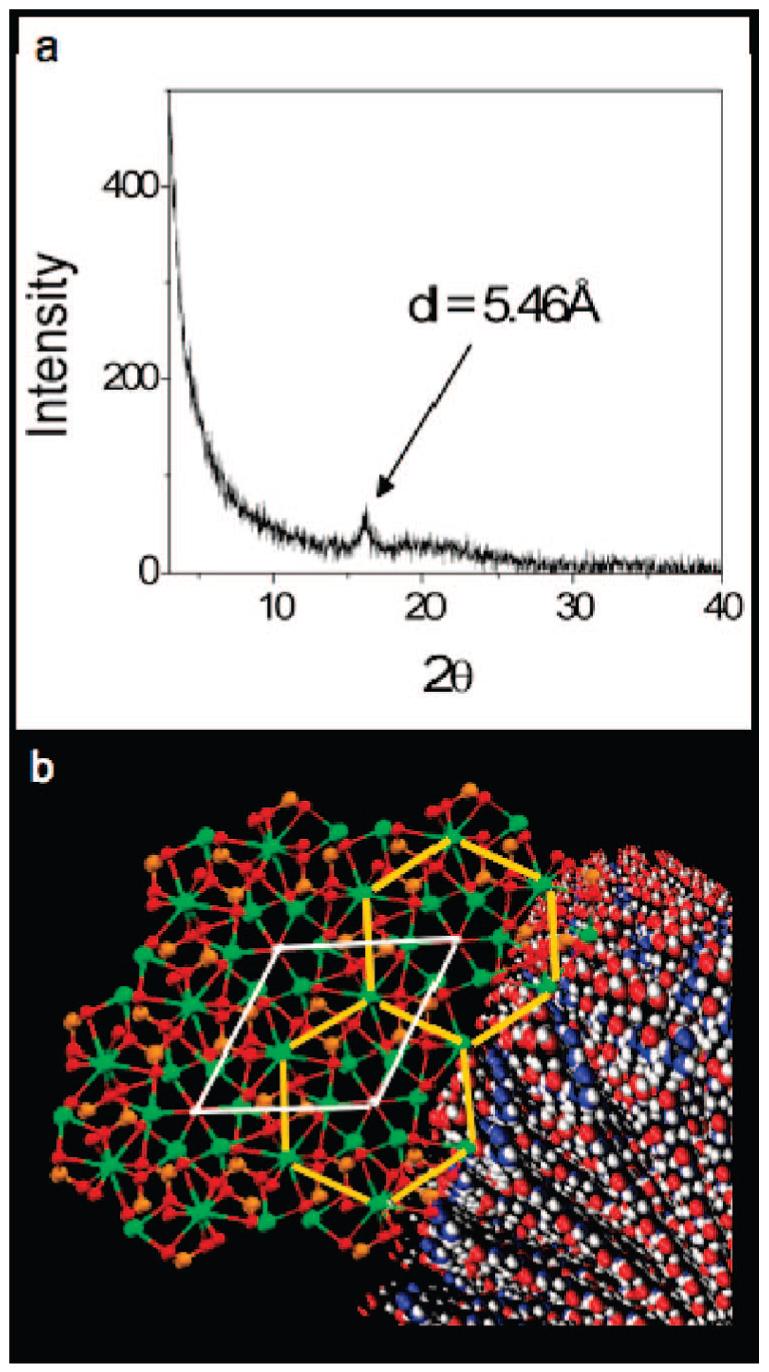
(a) Powder XRD scan of calcium-gelled PA showing a significant peak at 5.46 Å. Peaks corresponding to HA were not observed, and this peak was not present in PA not exposed to calcium ions. (b) A visualization of a HA crystal nucleating off calcium ions spaced 5.46 Å apart on the PA nanofiber. Calcium ions are shown in green, phosphorus in orange, oxygen in red, and hydrogen in white, while white lines depict the borders of the HA unit cell. The HA crystal is shown with its c-axis parallel to the long axis of the PA nanofiber. Yellow lines trace the 5.45 Å interatomic spacings of calcium ions arranged hexagonally throughout the 002 planes of the HA crystal.
References
-
- Lowenstam HA. Science. 1981;211:1126. - PubMed
-
- Mann S. Nature. 1993;365:499.
-
- Mann S, Archibald DD, Didymus JM, Douglas T, Heywood BR, Meldrum FC, Reeves NJ. Science. 1993;261:1286. - PubMed
-
- Fritz M, Belcher AM, Radmacher M, Walters DA, Hansma PK, Stucky GD, Morse DE, Mann S. Nature. 1994;371:49.
-
- Shen X, Belcher AM, Hansma PK, Stucky GD, Morse DE. J. Biol. Chem. 1997;272:32472. - PubMed
Publication types
MeSH terms
Substances
Grants and funding
LinkOut - more resources
Full Text Sources
Other Literature Sources
