. 2008 Nov 14;29(5):758-70.
doi: 10.1016/j.immuni.2008.09.018.

Retinoic acid enhances Foxp3 induction indirectly by relieving inhibition from CD4+CD44hi Cells

Affiliations

Retinoic acid enhances Foxp3 induction indirectly by relieving inhibition from CD4+CD44hi Cells

Jonathan A Hill et al. Immunity. .

Abstract

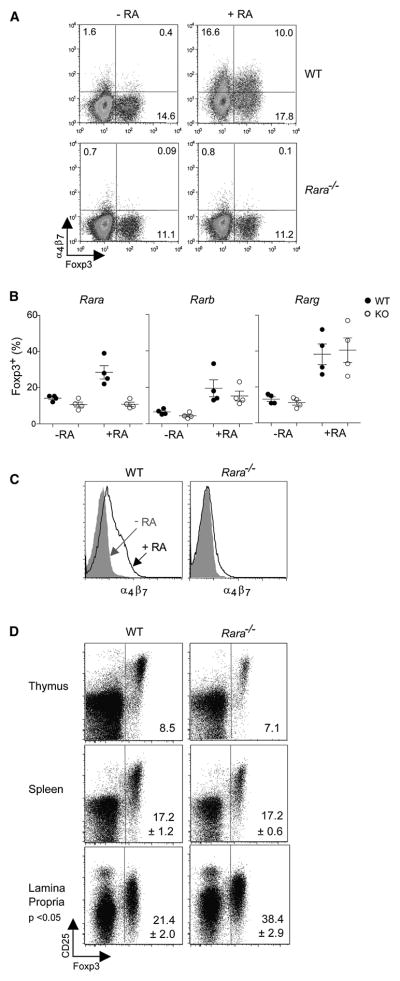
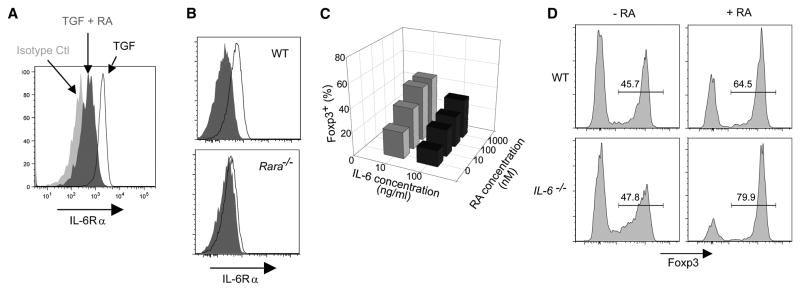
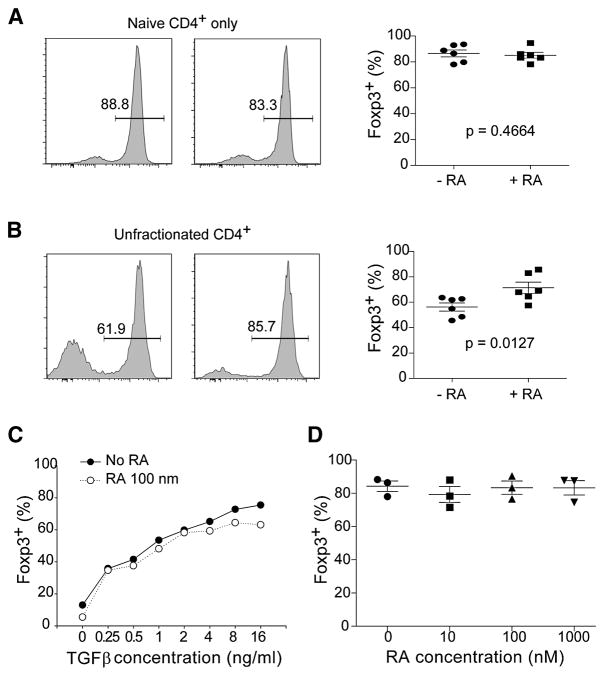
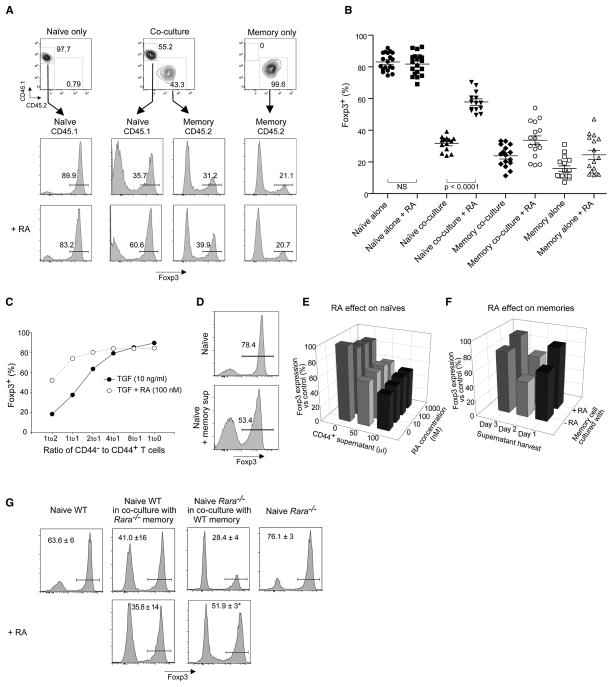
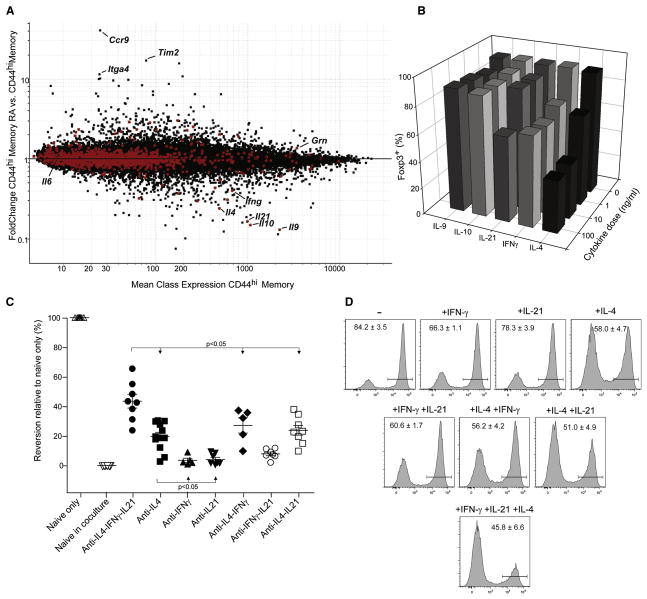
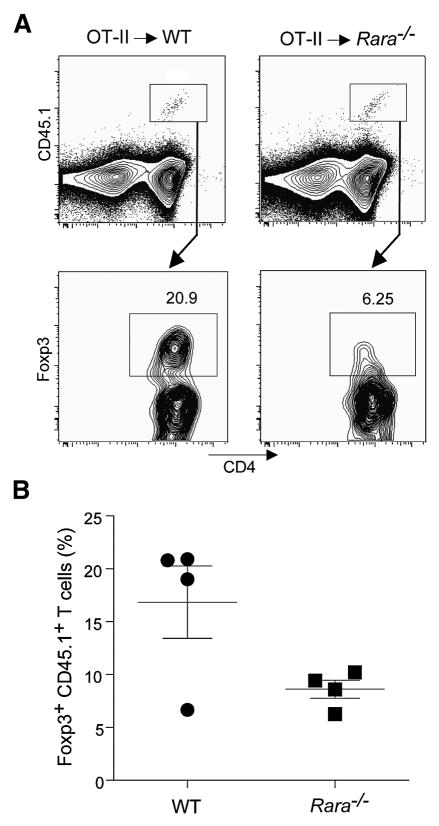
CD4(+)Foxp3(+) regulatory T (Treg) cells originate primarily from thymic differentiation, but conversion of mature T lymphocytes to Foxp3 positivity can be elicited by several means, including in vitro activation in the presence of TGF-beta. Retinoic acid (RA) increases TGF-beta-induced expression of Foxp3, through unknown molecular mechanisms. We showed here that, rather than enhancing TGF-beta signaling directly in naive CD4(+) T cells, RA negatively regulated an accompanying population of CD4(+) T cells with a CD44(hi) memory and effector phenotype. These memory cells actively inhibited the TGF-beta-induced conversion of naive CD4(+) T cells through the synthesis of a set of cytokines (IL-4, IL-21, IFN-gamma) whose expression was coordinately curtailed by RA. This indirect effect was evident in vivo and required the expression of the RA receptor alpha. Thus, cytokine-producing CD44(hi) cells actively restrain TGF-beta-mediated Foxp3 expression in naive T cells, and this balance can be shifted or fine-tuned by RA.


Figures

Fig. 1
Fig. 1. RARα is responsible for the enhanced conversion mediated by retinoic acid
CD4+CD25− T cells were sorted and cultured in vitro with CD11c+ dendritic cells (ratio 10:1 T cell to DC) in the presence of anti-CD3 antibody (1μg/ml) and TGFβ (10 ng/ml), with or without 10nM RA for 5 days. A) Foxp3 and α4β7 expression is reduced in CD4+ T cells when cells are obtained from RARα KO mice compared to WT littermate controls (representative FACS plot from 2 or more independent experiments). B) Summary of TGFβ mediated conversion in cultures from WT or RARα, RARβ or RARγ KO mice treated with or without RA (p<0.05, students t-test). C) RARα also controls the expression of α4β7 expression in cultures treated with TGFβ and RA (representative FACS plot from 2 or more independent experiments). D) RARα deletion in mice alters the proportion of CD4+Foxp3+ T cells in the lamina propria, but not the thymus or spleen. Organs were processed from RARα +/+ or −/− mice and Foxp3 and CD25 expression on CD4+ T cells was determined by FACS. Numbers in the gates represent the mean (+/− SD where applicable) for Foxp3 expression (thymus, n=2, spleen, n=5, and lamina propria, n=8), and p-value was determined by t-test.
Fig. 2
Fig. 2. Retinoic acid influences the expression of a discrete group of genes that are largely independent of the canonical Treg cell genomic signature
A) Comparison of probe expression values in Foxp3+ T cells after culture with anti-CD3, TGFβ and: lamina propria DCs (y-axis) or spleen DCs (x-axis), left pannel; or spleen DCs with (y-axis) or without (x-axis) retinoic acid (100 nM), right pannel. Probes highlighted in red and blue correspond to genes either up or down-regulated (respectively) in the canonical Treg cell genomic signature. B) “Signature Match” Heat map analysis of the Treg cell genomic signature in ex vivo Treg cells or TGFβ converted cells (Foxp3+, anti-CD3/CD28, TGF, and Foxp3-, anti-CD3/CD28 are from (Hill et al., 2007)). Raw expression values were normalized to 1 or zero for ex vivo Treg cells or Tcov cells respectively. The expression values for genes from the TGFβ converted cells were normalized within this range (for a detailed description of the algorithm see supplemental experimental procedures) and displayed as a heat map where red represents the expression of a gene at the same or a greater level than what is found in an ex vivo Treg cell, while black is the expression of a gene that is at the same or lower level than an ex vivo Tconv cell. Numbers to the right of the diagram show the average score for each group across the entire signature. C) FcFc plot comparing the effects of retinoic acid in Foxp3+ TGFβ converted cells (y-axis) with ex vivo Treg cells (x-axis). D) FcFc plot comparing the effects of retinoic acid in Foxp3+ (y-axis) and Foxp3-(x-axis) TGFβ treated cells.
Fig. 3
Fig. 3. Retinoic acid down-regulates the IL-6Rα but enhancement of Foxp3 expression by RA occurs in the absence of IL-6
A) Expression of IL-6Rα is down-regulated in CD4+ T cells by retinoic acid. Splenocytes (1×10⁵) were activated with anti-CD3/CD28 beads in the absence (TGF, open histogram) or presence of RA (TGF +RA, dark grey histogram). Representative FACS plots are shown (n=6 independent experiments). B) CD4+ T cells from retinoic acid receptor alpha deficient (RARα KO) mice do not down regulate the IL-6R after culture with RA. CD4+ T cells (0.5 × 10⁵) from wild-type (WT) or RARαKO mice were activated with anti-CD3/CD28 beads and TGFβ (10 ng/ml) in the absence (open histogram) or presence (filled histogram) of retinoic acid (100nM). Representative FACS plots are shown (n=3 independent experiments). C) Retinoic acid prevents the inhibition of Foxp3 expression mediated by IL-6 in CD4+ T cells activated with TGFβ. CD4+ T cells (0.5 × 10⁵) were activated with anti-CD3/CD28 beads and various concentrations of RA. After 24hrs TGFβ (10 ng/ml) and IL-6 were added and cells were cultured for an additional 4 days. Representative FACS data is shown for Foxp3 expression in CD4+ T cells (n=3 independent experiments). D) Retinoic acid enhances Foxp3 expression in CD4+ T cells in the absence of IL-6. Splenocytes from wild-type or IL-6KO mice were stimulated (as in A) and analyzed 4 days later for Foxp3 expression in CD4+ T cells. Representative FACS plots are shown (n=3 independent experiments).
Fig. 4
Fig. 4. Retinoic acid acts indirectly on Foxp3 expression
A) Retinoic acid does not enhance TGFβ mediated Foxp3 expression in purified naïve CD4+ T cells. Naïve CD25CD44loCD62Lhi CD4+ T cells (0.5 × 10⁵) were activated with anti-CD3/CD28 beads and TGFβ (10 ng/ml) in the absence (left panel) or presence of RA (100 nM) (middle panel) for 4 days. Representative FACS data is shown for Foxp3 expression with the results of multiple experiments plotted in the right panel (n=6, and p-value for student’s t-test). B) Retinoic acid does enhance TGFβ mediated Foxp3 expression in CD4+ T cells from unfractionated splenocytes. Splenocytes (0.5 × 10⁵) were activated in vitro (as in A) in the absence (left panel) or presence of RA (100 nM) (middle panel) for 4 days. Representative FACS data is shown for Foxp3 expression in CD4+ T cells with the results of multiple experiments plotted in the right panel (n=6, and p value for student’s t-test). C) Retinoic acid does not enhance Foxp3 expression in purified naïve CD4+ T cells over a range of TGFβ concentrations. Naïve CD4+ T cells (purified as in A) were activated with anti-CD3/CD28 beads in the presence of 100nM RA and the indicated doses of TGFβ, then analyzed at day 4 for Foxp3 expression by FACS. Representative data is shown for 3 independent experiments. D) Foxp3 expression is not enhanced in naïve CD4+ T cells over a range of retinoic acid doses. Naïve CD4+ T cells were activated (as in A) in the presence of the indicated concentrations of RA, then analyzed for Foxp3 expression by FACS. Summarized data from 3 independent experiments is shown.
Fig. 5
Fig. 5. CD44hiMemory CD4 T cells restrain TGFβ mediated Foxp3 expression in naïve CD4 T cells
A) Naïve CD25CD44loCD62Lhi CD4+ T cells (0.5 × 10⁵) were activated with anti-CD3/CD28 beads and TGFβ (10 ng/ml) in the absence or presence of RA (100 nM). These cells were either cultured alone, or in combination with CD25CD44hiD62Llo memory CD4+ T cells (0.5 × 10⁵ memory cells to 0.25 × 10⁵ naïve cells) for 4 days. For comparison, CD44hi memory T cells were also cultured alone (under identical conditions as naïve cells cultured alone). Individual populations were tracked using CD45.1 or CD45.2 congenic markers. Foxp3 expression in congenically marked populations was determined by FACS and a representative experiment is shown. B) FACS analysis for Foxp3 expression in multiple experiments as described in A (n=14–19). Statistically significant differences, with p-values < 0.05 determined by student’s t-test, were found between all of the groups except for ▲ vs ○, and ◆ vs △. C) The contra-conversion effect of CD44hi memory T cells is dose dependent and parallels the responsiveness to RA. Co-culture experiments with congenically marked CD44hi memory or naïve T cells were performed in the absence or presence of RA and using different ratios of CD44hi memory T cells to naïve T cells (0.5 × 10⁵). Cells were activated (as in A) and analyzed for Foxp3 expression 4 days later. Data presented is representative of 3 independent experiments. D) Supernatant from memory T cells activated with anti-CD3/CD28 beads for 48hrs can inhibit Foxp3 expression in naïve T cells. E) Retinoic acid does not act on the responsiveness of naïve T cells to the soluble inhibitory factor produced by memory T cells. Naïve T cells were activated with anti-CD3/CD28 beads and the indicated concentrations of retinoic acid for 24 hrs, then cultured in the presence of TGFβ (10 ng/ml) and the indicated concentration of supernatant from memory T cells for 4 days. Representative FACS data from one of 3 experiments is shown. Data is presented as percent Foxp3 expression in the test condition relative to that found in naïve T cells alone (control). F) Retinoic acid inhibits the production of the soluble factor produced by memory T cells. Memory T cells were activated and cultured in the presence or absence of RA. Supernatant were harvested at different time points and added to naïve T cells in the conversion assay. Representative FACS data from one of 3 experiments is shown. Data is presented as percent Foxp3 expression in the test condition relative to that found in naïve T cells alone (control). G) Retinoic acid receptor alpha mediated signaling in CD44hi memory T cells is necessary to enhance Foxp3 expression in naïve cells. Criss-cross experiments with RARα KO memory (left panel) or naïve (right panel) CD4+ T cells in co-culture with congenically marked WT naïve (left panel) or memory (right panel) CD4+ T cells were conducted as described in A). No enhancement of Foxp3 expression was seen when RARα KO memory CD4+ T cells were cultured with WT naïve CD4+ T cells in the presence of RA. A significant enhancement (p<0.01) of Foxp3 expression was seen when RARα KO naïve CD4+ T cells were cultured with WT memory CD4+ T cells in the presence of RA. Representative FACS plots are shown with the mean and SD from 3 independent experiments.
Fig. 6
Fig. 6. Contra-conversion is mediated by cytokines and alleviated by blocking IL-4, IFNγ and IL-21
Congenically marked CD44hi memory CD4+ T cells were isolated from the co-culture assay at 48 hrs and processed for microarray analysis. A) Mean expression (CD44hi memory T cells, x-axis) vs FoldChange (CD44hi memory RA/CD44hi memory T cells, y-axis) plot of expression data from memory T cells treated with or without RA in the co-culture assay. Secreted extra-cellular factors identified from gene ontology (GO) analysis are highlighted in red. A) Recombinant cytokines were added individually to cultures of naïve CD4+ T cells activated with anti-CD3/CD28 beads and TGFβ. Cells were harvested at day 4 to test for Foxp3 expression by FACS. Representative data is shown for one of 3 or more experiments. B) Inhibition of cytokine signaling in co-culture experiments using blocking antibodies. Naïve and memory co-culture experiments were performed in the absence or presence of cytokine blocking antibodies (5 μg/ml). Cells were harvested at day 4 to test for Foxp3 expression in congenically marked cells by FACS. Statistically significant differences, with p-values < 0.05 determined by student’s t-test, were found between all of the groups except for ■ vs ◆ or □, and ▲ vs ▽ or ○. C) Recombinant IFNγ (1 ng/ml), IL-4 (1 ng/ml), and IL-21 (10 ng/ml) was added individually, in pairs or all together to cultures of naïve CD4+ T cells activated with anti-CD3/CD28 beads and TGFβ. Cells were harvested at day 4 and tested for Foxp3 expression by FACS. Representative FACS data with average values +/− SEM for 6 individual experiments.
Fig. 7
Fig. 7. RARα signaling can indirectly alter Foxp3 conversion in vivo
A) Foxp3 OT-II RAG-1−/− CD45.1 CD4+ T cells were sorted then injected IV into RARα KO mice or WT littermates (0.5–1 × 10⁶ cells/mouse). Mice were given water supplemented with ovalbumin (1.5%) for 7 days after which point they were sacrificed and donor OT-II CD45.1 T cells from various lymphoid organs were analyzed for Foxp3 expression by FACS. Representative FACS plots showing Foxp3 expression in CD45.1+ CD4+ T cells from the mesenteric lymph nodes of either a WT or RARα KO host. B) Summary of Foxp3 expression in donor CD45.1+ OT-II T cells harvested from lamina propria or mesenteric lymph nodes of RARα KO mice or WT littermate controls from multiple experiments.

Comment in

References

    1. Abb J, Abb H, Deinhardt F. Effect of retinoic acid on the spontaneous and interferon-induced activity of human natural killer cells. Int J Cancer. 1982a;30:307–310. - PubMed
    1. Abb J, Abb H, Deinhardt F. Retinoic acid suppression of human leukocyte interferon production. Immunopharmacology. 1982b;4:303–310. - PubMed
    1. Altucci L, Gronemeyer H. The promise of retinoids to fight against cancer. Nat Rev Cancer. 2001;1:181–193. - PubMed
    1. Apostolou I, von Boehmer H. In vivo instruction of suppressor commitment in naive T cells. J Exp Med. 2004;199:1401–1408. - PMC - PubMed
    1. Benson MJ, Pino-Lagos K, Rosemblatt M, Noelle RJ. All-trans retinoic acid mediates enhanced T reg cell growth, differentiation, and gut homing in the face of high levels of co-stimulation. J Exp Med. 2007;204:1765–1774. - PMC - PubMed

Publication types

MeSH terms

Associated data