

doi: 10.2144/000112960.
Improvements to bead-based oligonucleotide ligation SNP genotyping assays
Affiliations
- PMID: 19007340
- PMCID: PMC3987951
- DOI: 10.2144/000112960
Item in Clipboard
Improvements to bead-based oligonucleotide ligation SNP genotyping assays
Biotechniques.
2008 Nov.
Abstract
We describe a bead-based, multiplexed, oligonucleotide ligation assay (OLA) performed on the Luminex flow cytometer. Differences between this method and those previously reported include the use of far fewer beads and the use of a universal oligonucleotide for signal detection. These innovations serve to significantly reduce the cost of the assay, while maintaining robustness and accuracy. Comparisons are made between the Luminex OLA and both pyrosequencing and direct sequencing. Experiments to assess conversion rates, call rates, and concordance across technical replicates are also presented.
Figures
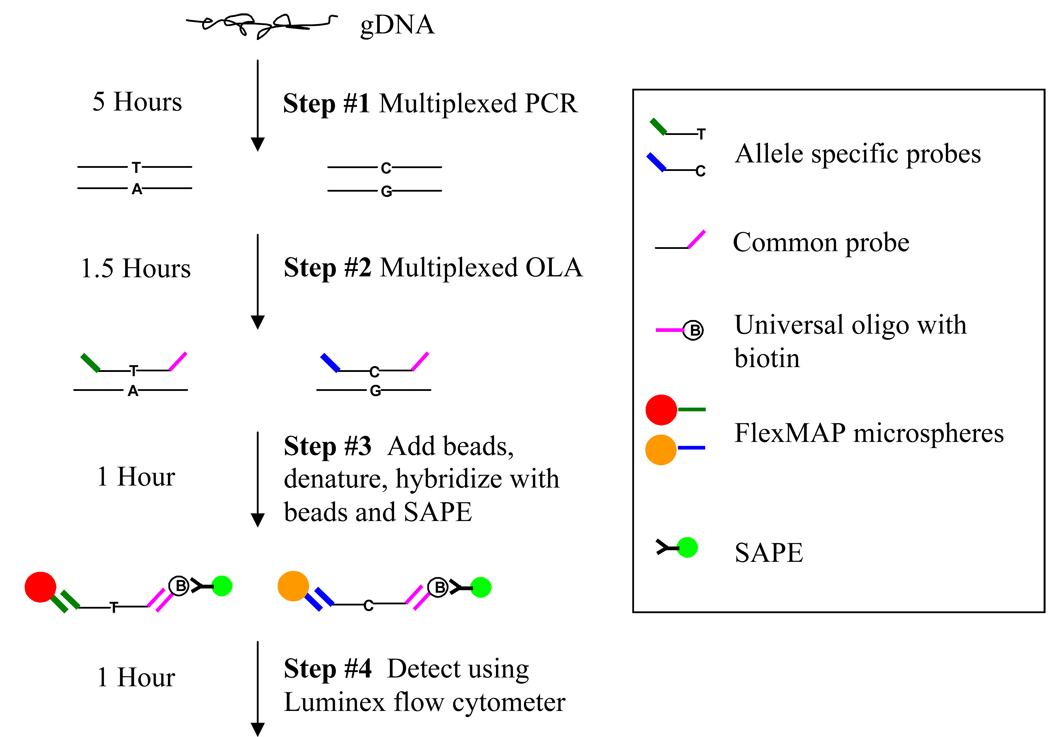
The assay consists of four steps; 1) Multiplexed PCR 2) multiplexed OLA 3) hybridization with beads and SAPE 4) Detection using the Luminex flow cytometer. Steps 2–4 take place in the same 96-well plate.
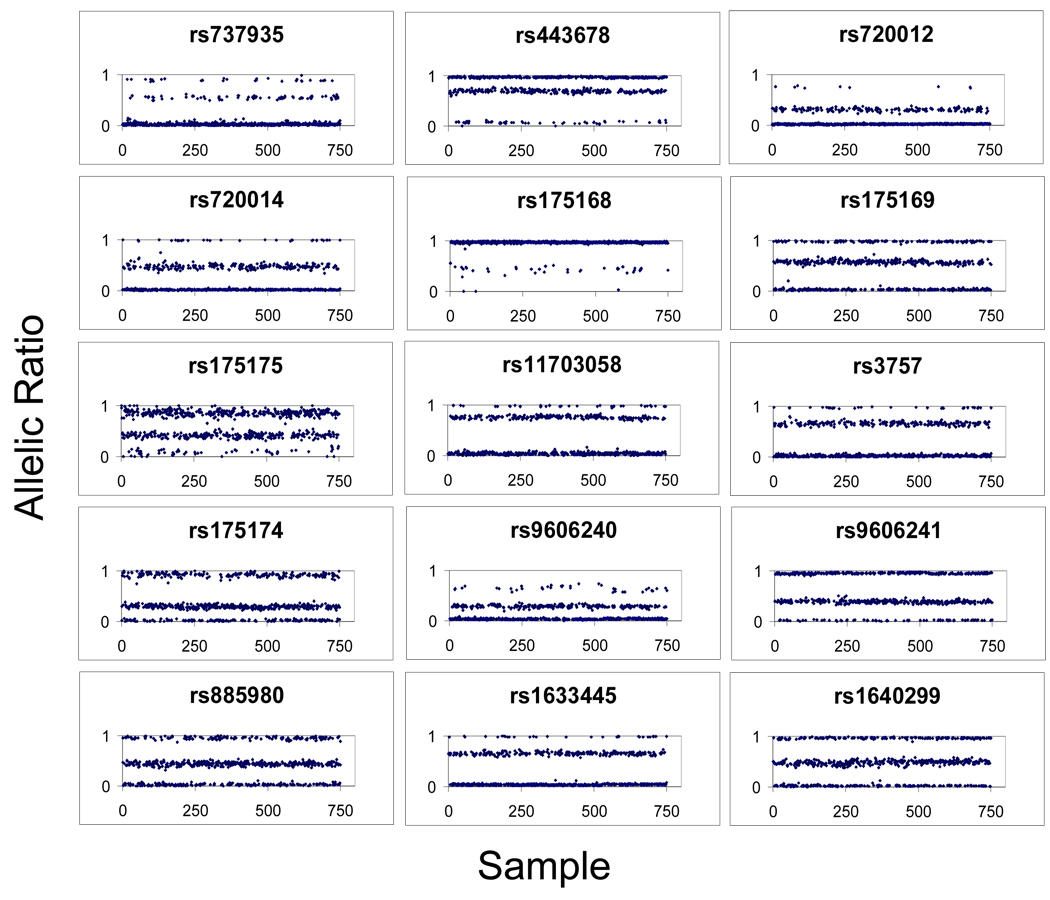
Individual figures represent the allelic ratios (X axis) produced from a first pass genotyping of 750 human genomic DNA samples (Y axis). Variability in allelic ratios is observed for different SNP assays, generally with skewing of heterozyote clusters, though homozygote clusters can also be skewed (i.e. rs9606240). Nonetheless, for each SNP genotype clusters are robust (see Table 4 for silhouette scores).
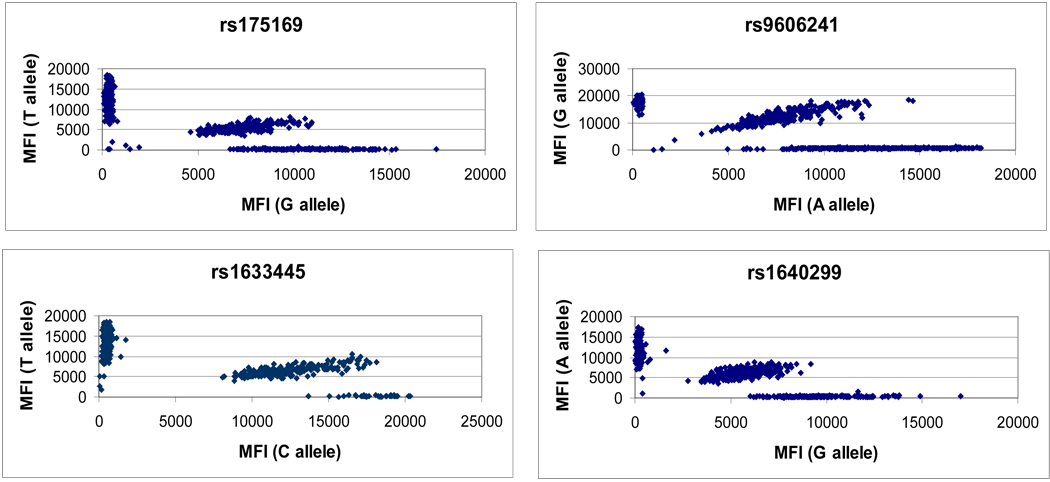
Each scatterplot represents the median fluorescence intensity (MFI) of allele 1 and allele 2 for four SNPs. The scatterplots represent the raw data from which allelic ratios (figure 2) were calculated.
References
-
- Thomas FJ, McLeod HL, Watters JW. Pharmacogenomics: the influence of genomic variation on drug response. Curr Top Med Chem. 2004;4(13):1399–1409. - PubMed
-
- Gunderson KL, et al. Whole-genome genotyping. Methods Enzymol. 2006;410:359–376. - PubMed
-
- Kennedy GC, et al. Large-scale genotyping of complex DNA. Nat Biotechnol. 2003;21(10):1233–1237. - PubMed
Publication types
MeSH terms
Substances
Grants and funding
LinkOut - more resources
Full Text Sources
Other Literature Sources
Miscellaneous