

Mapping of DDR1 distribution and oligomerization on the cell surface by FRET microscopy
- PMID: 19007791
- PMCID: PMC2786213
- DOI: 10.1016/j.jmb.2008.10.067
Mapping of DDR1 distribution and oligomerization on the cell surface by FRET microscopy
Erratum in
- J Mol Biol. 2013 May 27;425(10):1846
Abstract
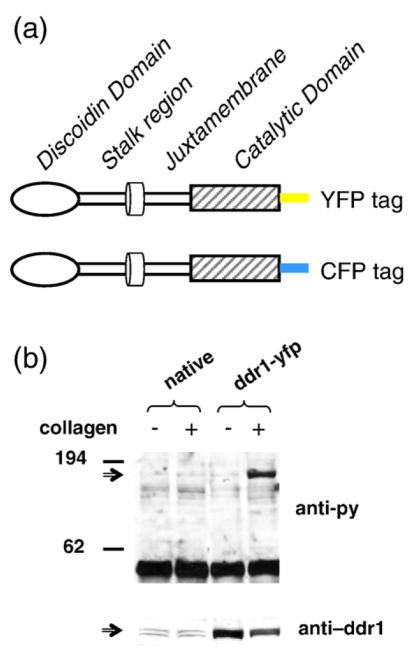
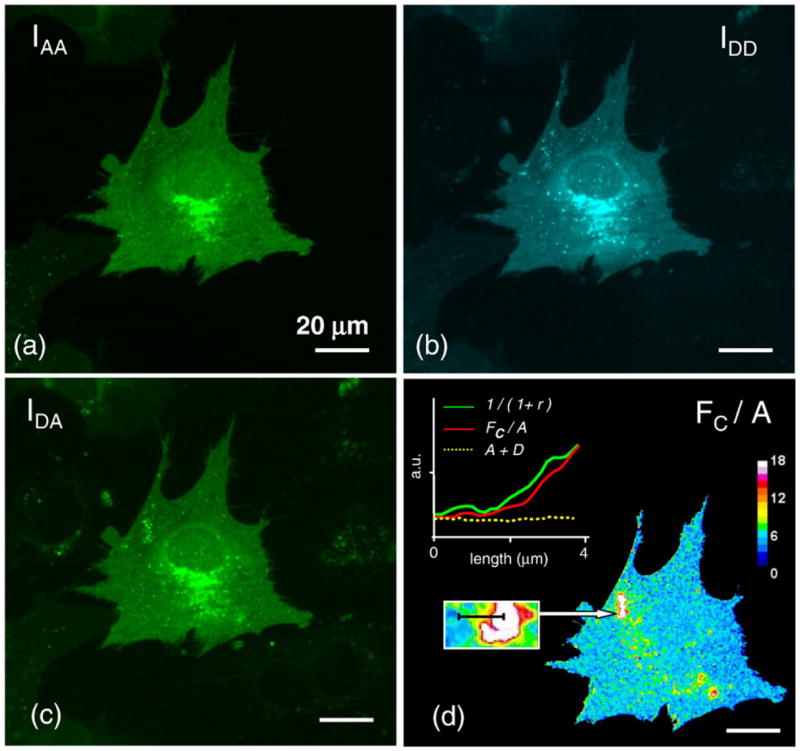
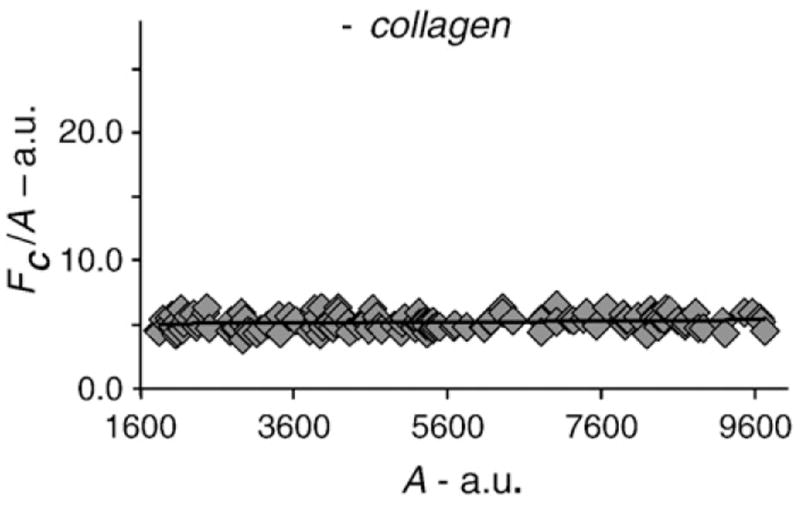
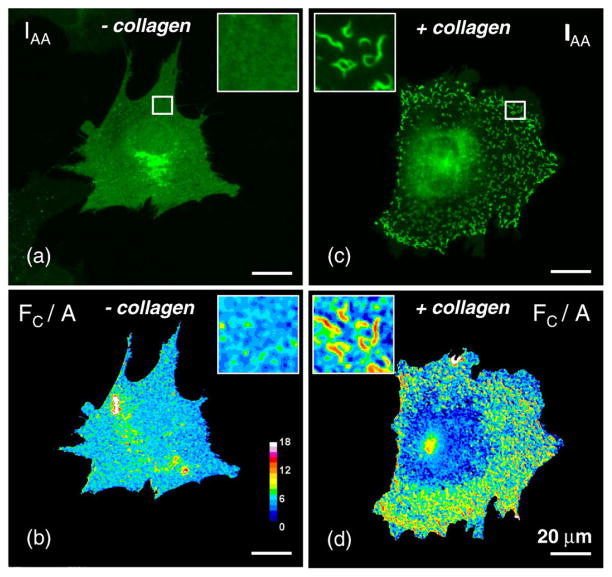
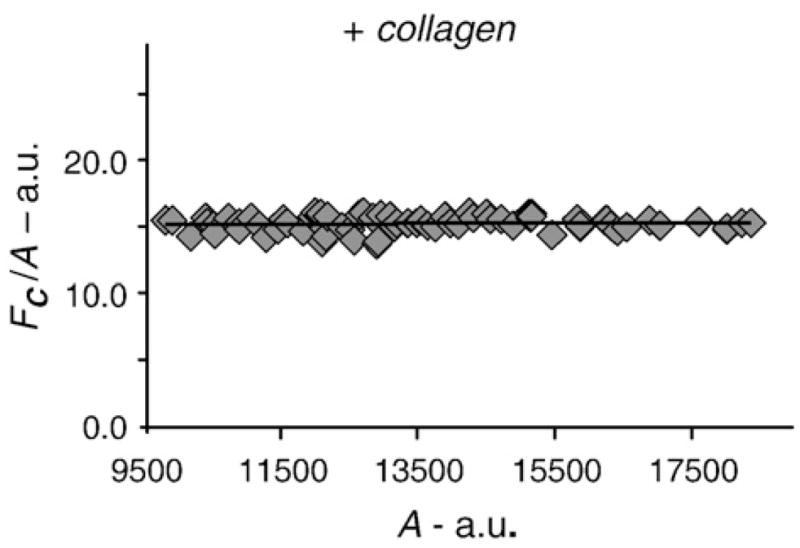
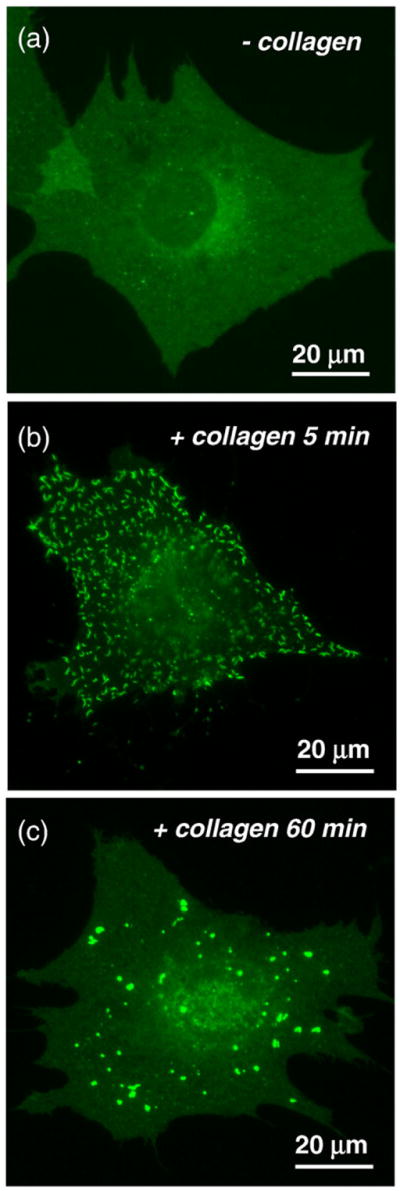
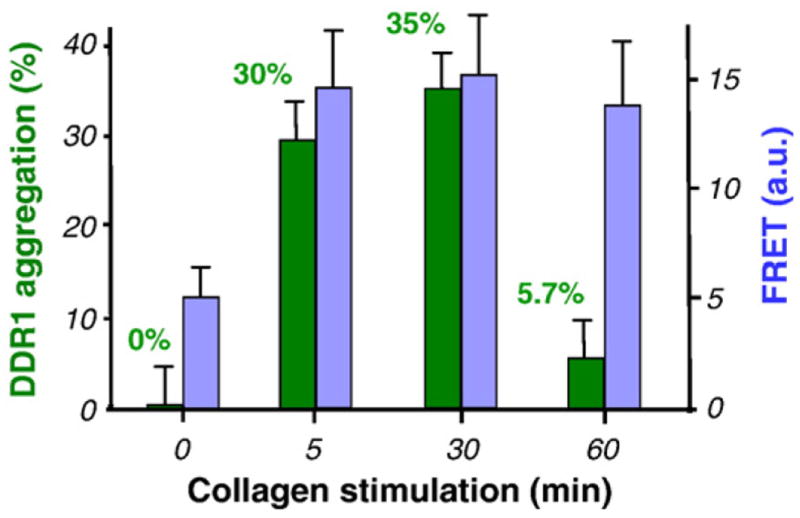
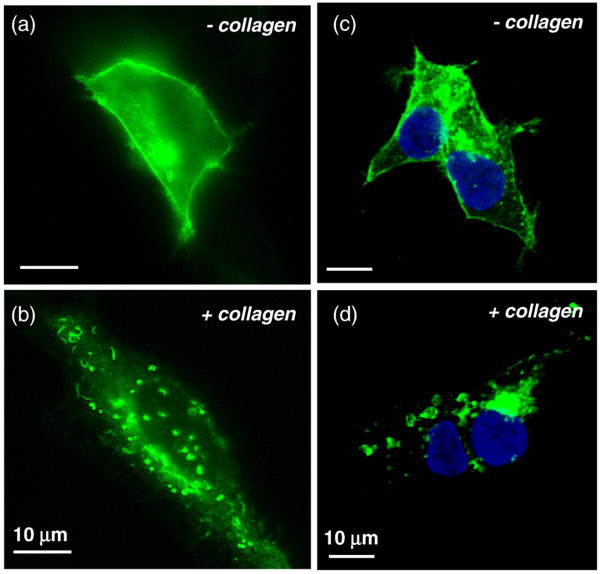
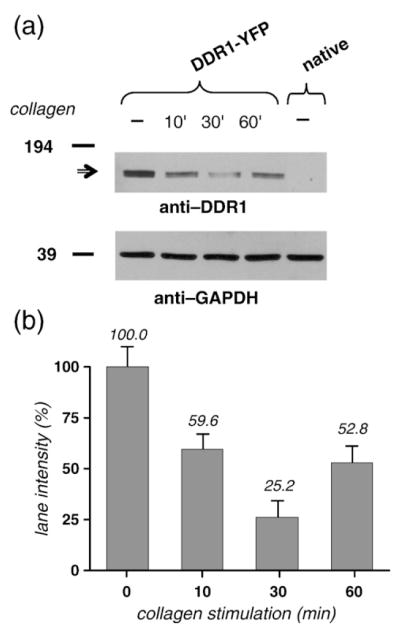
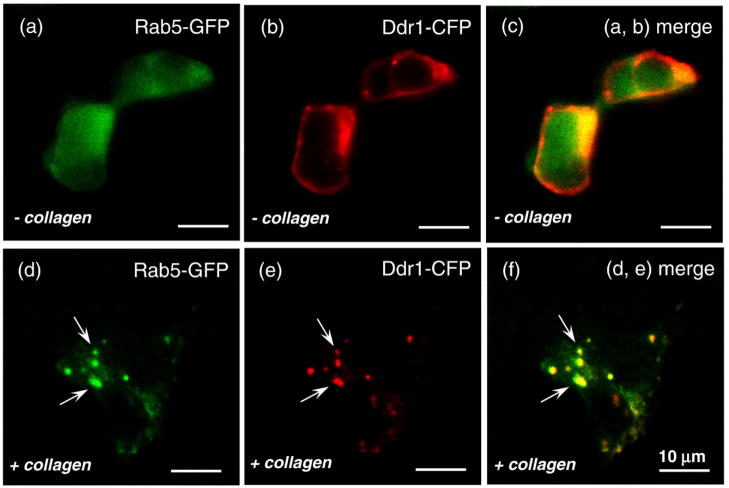
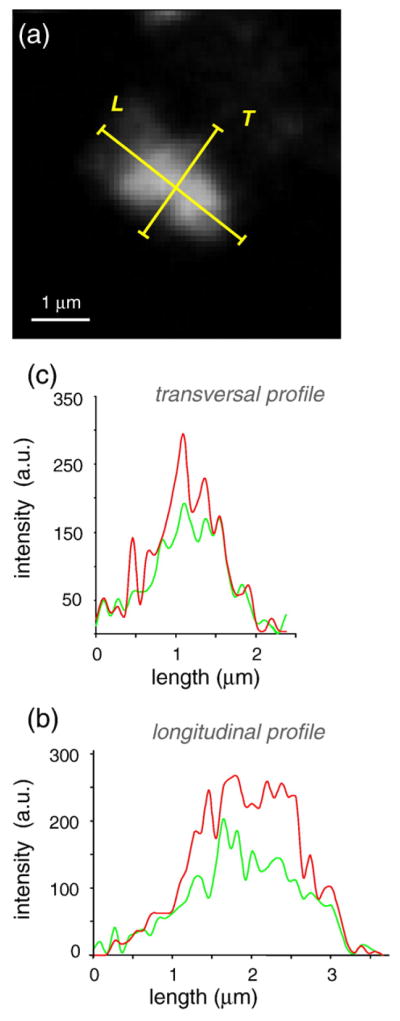
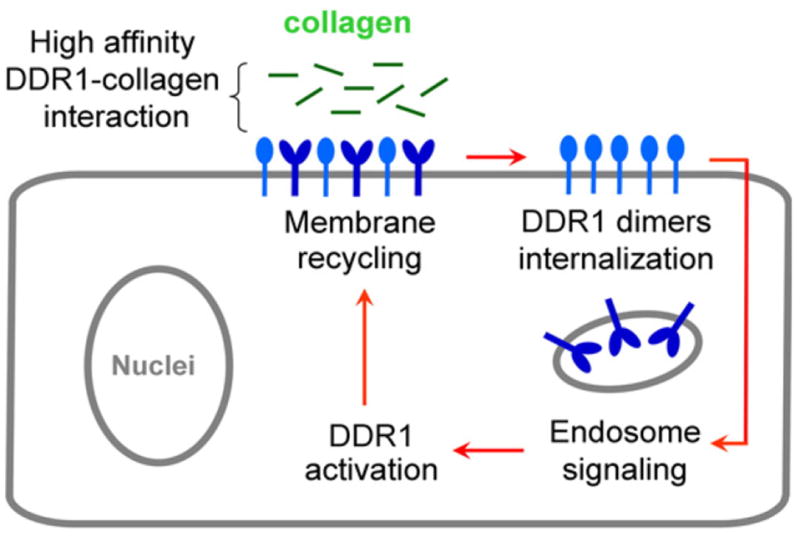
Activation of discoidin domain receptor (DDR) 1 by collagen is reported to regulate cell migration and survival processes. While the oligomeric state of DDR1 is reported to play a significant role in collagen binding, not much is known about the effect of collagen binding on DDR1 oligomerization and cellular distribution. Using fluorescence resonance energy transfer (FRET) microscopy, we monitored the interaction between DDR1 tagged with cyan fluorescent protein and DDR1 tagged with yellow fluorescent protein in live cells. Significant FRET signal indicative of receptor dimerization was found even in the absence of collagen stimulation. Collagen stimulation induced aggregation of DDR1, followed by a sharp increase in FRET signal, localized in the regions of aggregated receptor. Further analysis of DDR1 aggregation revealed that DDR1 undergoes cytoplasmic internalization and incorporation into the early endosome. We found the kinetics of DDR1 internalization to be fast, with a significant percentage of the receptor population being internalized in the first few minutes of collagen stimulation. Our results indicate that collagen stimulation induces the aggregation and internalization of DDR1 dimers at timescales much before receptor activation. These findings provide new insights into the cellular redistribution of DDR1 following its interaction with collagen type I.
Figures
Similar articles
-
Oligomerization of DDR1 ECD affects receptor-ligand binding.J Struct Biol. 2013 Sep;183(3):495-500. doi: 10.1016/j.jsb.2013.06.010. Epub 2013 Jun 28. J Struct Biol. 2013. PMID: 23810922 Free PMC article.
-
Glycosylation at Asn211 regulates the activation state of the discoidin domain receptor 1 (DDR1).J Biol Chem. 2014 Mar 28;289(13):9275-87. doi: 10.1074/jbc.M113.541102. Epub 2014 Feb 7. J Biol Chem. 2014. PMID: 24509848 Free PMC article.
-
Collagen stimulates discoidin domain receptor 1-mediated migration of smooth muscle cells through Src.Cardiovasc Pathol. 2011 Mar-Apr;20(2):71-6. doi: 10.1016/j.carpath.2009.12.006. Epub 2010 Jan 25. Cardiovasc Pathol. 2011. PMID: 20093046
-
Exploring the Cellular and Molecular Mechanism of Discoidin Domain Receptors (DDR1 and DDR2) in Bone Formation, Regeneration, and Its Associated Disease Conditions.Int J Mol Sci. 2023 Oct 4;24(19):14895. doi: 10.3390/ijms241914895. Int J Mol Sci. 2023. PMID: 37834343 Free PMC article. Review.
-
Collagen recognition and transmembrane signalling by discoidin domain receptors.Biochim Biophys Acta. 2013 Oct;1834(10):2187-94. doi: 10.1016/j.bbapap.2012.10.014. Epub 2012 Nov 2. Biochim Biophys Acta. 2013. PMID: 23128141 Free PMC article. Review.
Cited by
-
Novel cross talk between IGF-IR and DDR1 regulates IGF-IR trafficking, signaling and biological responses.Oncotarget. 2015 Jun 30;6(18):16084-105. doi: 10.18632/oncotarget.3177. Oncotarget. 2015. PMID: 25840417 Free PMC article.
-
Inhibition of Discoidin Domain Receptor 1 Reduces Collagen-mediated Tumorigenicity in Pancreatic Ductal Adenocarcinoma.Mol Cancer Ther. 2017 Nov;16(11):2473-2485. doi: 10.1158/1535-7163.MCT-16-0834. Epub 2017 Sep 1. Mol Cancer Ther. 2017. PMID: 28864681 Free PMC article.
-
Discoidin domain receptors promote α1β1- and α2β1-integrin mediated cell adhesion to collagen by enhancing integrin activation.PLoS One. 2012;7(12):e52209. doi: 10.1371/journal.pone.0052209. Epub 2012 Dec 20. PLoS One. 2012. PMID: 23284937 Free PMC article.
-
Oligomerization of DDR1 ECD affects receptor-ligand binding.J Struct Biol. 2013 Sep;183(3):495-500. doi: 10.1016/j.jsb.2013.06.010. Epub 2013 Jun 28. J Struct Biol. 2013. PMID: 23810922 Free PMC article.
-
Spatial localisation of Discoidin Domain Receptor 2 (DDR2) signalling is dependent on its collagen binding and kinase activity.Biochem Biophys Res Commun. 2018 Jun 18;501(1):124-130. doi: 10.1016/j.bbrc.2018.04.191. Epub 2018 May 3. Biochem Biophys Res Commun. 2018. PMID: 29709482 Free PMC article.
References
-
- Vogel W, Gish GD, Alves F, Pawson T. The discoidin domain receptor tyrosine kinases are activated by collagen. Mol Cell. 1997;1:13–23. - PubMed
-
- Shrivastava A, Radziejewski C, Campbell E, Kovac L, McGlynn M, Ryan TE, et al. An orphan receptor tyrosine kinase family whose members serve as nonintegrin collagen receptors. Mol Cell. 1997;1:25–34. - PubMed
-
- Vogel W. Discoidin domain receptors: structural relations and functional implications. FASEB J. 1999;13(Supplement):S77–S82. - PubMed
-
- Franco CD, Hou G, Bendeck MP. Collagens, integrins, and the discoidin domain receptors in arterial occlusive disease. Trends Cardiovasc Med. 2002;12:143–148. - PubMed
-
- Yamanaka R, Arao T, Yajima N, Tsuchiya N, Homma J, Tanaka R, et al. Identification of expressed genes characterizing long-term survival in malignant glioma patients. Oncogene. 2006;25:5994–6002. - PubMed
Publication types
MeSH terms
Substances
Grants and funding
LinkOut - more resources
Full Text Sources
Other Literature Sources
Molecular Biology Databases
