. 2009 Jan;49(2):228-36.
doi: 10.1016/j.visres.2008.10.015. Epub 2008 Nov 26.

Visibility states modulate microsaccade rate and direction

Affiliations

Visibility states modulate microsaccade rate and direction

Jie Cui et al. Vision Res. 2009 Jan.

Abstract

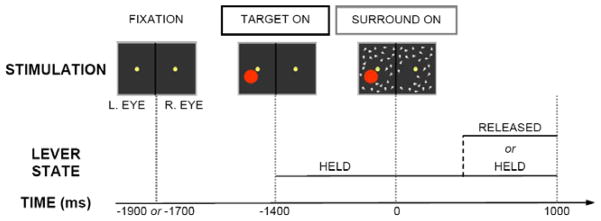
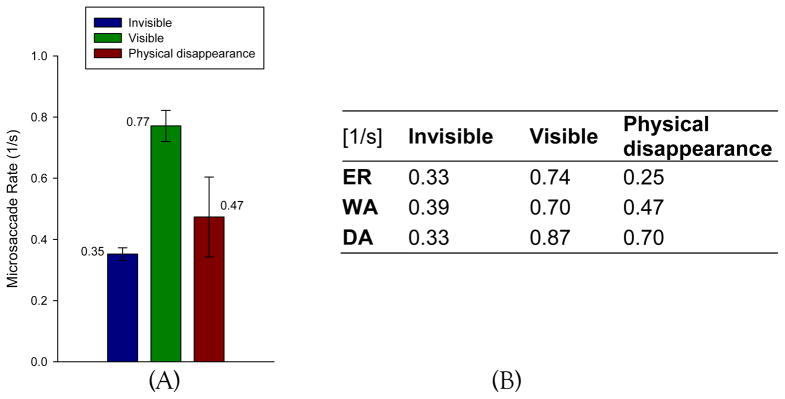
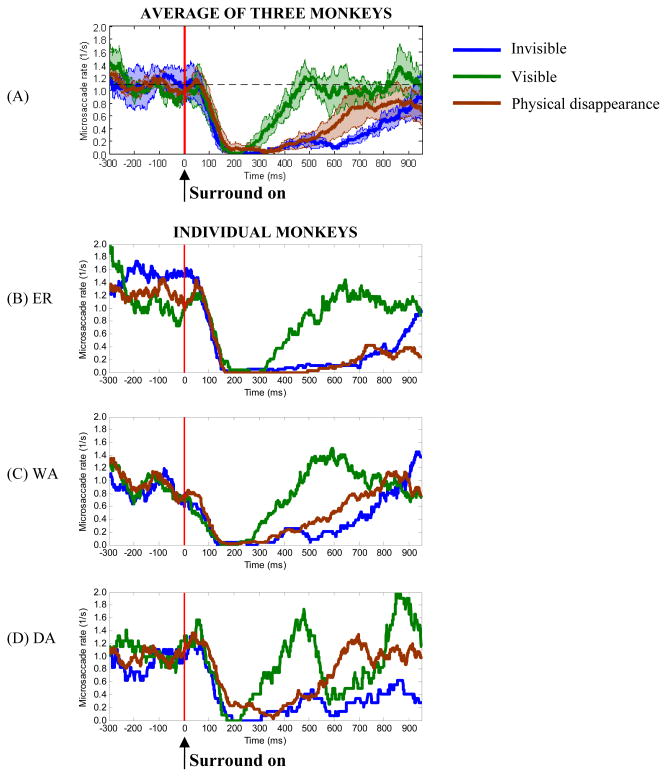
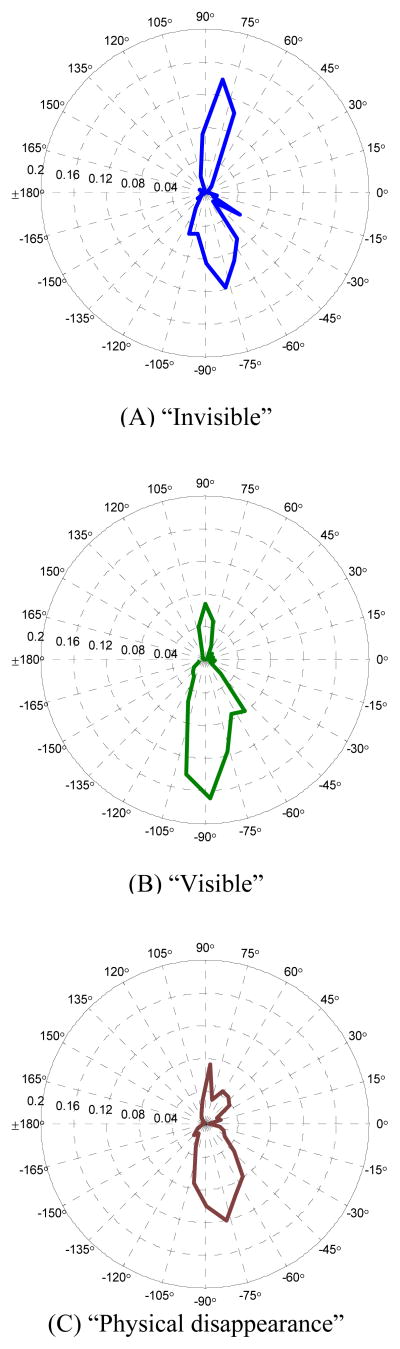
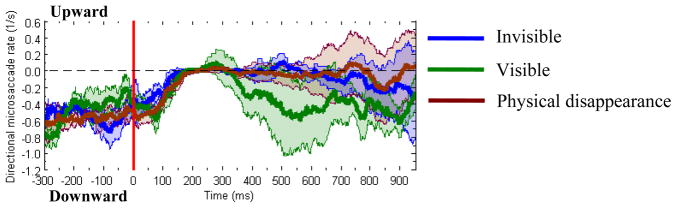
We investigated how the perceptual visibility of a target influences the pattern of microsaccadic eye movements expressed during generalized flash suppression. We found that the microsaccade rate was highly dependent on the reported visibility of the target. In the visible trials, the microsaccade rate promptly rebounded to the pre-onset level, whereas on the invisible trials the rate remained low, reaching pre-onset levels hundreds of milliseconds later. In addition, the directional distributions of microsaccades were biased to the target positions in the visible condition. The present findings indicate that the microsaccade behavior is highly correlated with the perceptual state of target visibility, and suggest that the measured microsaccade rate and direction are reliable indicators of the perception.


Figures

Figure 1
Figure 1
Illustration of generalized flash suppression (GFS) experimental paradigm. The figure shows the stimulation sequence and the states (held or released) of the lever provided to monkeys. Monkeys were required to maintain fixation after the appearance of fixation spots (FIXATION). They fixated on the central spots for 300 ms (in some sessions 500 ms) before the presentation of the target stimulus (red disk). After 1400 ms of the target only presentation (TARGET ON), a surrounding pattern consisting of randomly moving dots was added to the presentation (SURROND ON). Monkeys were required to hold the lever as long as the target was visible. If the target became invisible, either through perceptual suppression or physical removal, they had to release the lever within 800 ms. (Adapted from Fig. 1. in (Wilke et al., 2006) with permission)
Figure 2
Figure 2
Peak velocities of microsaccades as a function of amplitude (“main sequence”). Panel A shows the results in the invisible condition. The plot (A.1) contains 1440 microsaccades from all three monkeys, which were detected between target on and 1000 ms posterior to the surround onset. The correlation coefficient was 0.80. Specifically, the relationship of the 279 microsaccades detected after surround onset in the same condition was shown in the plot (A.2) with the correlation coefficient of 0.73. Panel B shows the results in the visible condition. The plot (B.1) contains 1770 microsaccades (r = 0.81), while the plot (B.2) contains 581 microsaccades (r = 0.82).
Figure 3
Figure 3
Microsaccade parameters of amplitude, duration and peak velocity in the “invisible”, “visible” and “physical disappearance” conditions. The microsaccades were detected after the onset of the surround patterns. The between-subject mean value of each parameter was first obtained for each monkey and then averaged across the three monkeys, which are shown above the bars for each condition. Error bars indicate 95% confidence intervals based on the standard error of mean (SEM).
Figure 4
Figure 4
Average microsaccade rates after surround onset by perceptual state. Panel (A) depicts the mean rates, shown above the bars, in three conditions. Error bars indicate ±1 SEM. Average microsaccade rates of individual monkeys are summarized in the table of panel (B).
Figure 5
Figure 5
Evolution of microsaccade rates in the conditions of “invisible”, “visible” and “physical disappearance” (physical removal of the target). Panel (A) shows the average microsaccade rates between 300 ms before and 950 ms after surround onset as a function of time. The horizontal dashed line represents the average microsaccade rate in the interval of −300 ms to 0 ms (1.08 1/s). The vertical red line displays the onset of surrounding patterns. Shadows around the mean indicate confidence bands of ± 1 SEM between monkeys (n = 3). The average rates from individual monkeys per condition are shown in panels (B) – (D). The rate of microsaccades has been calculated in a window of 100 ms width moving in 1 ms steps.
Figure 6
Figure 6
The directional distributions of microsaccades detected after surround onset. Polar plots of microsaccade direction probability density were computed from 30 equally spaced directional bins for three conditions (“invisible”, “visible” and “physical disappearance”). The distance from the center of the plot represents the proportion of the microsaccade contained in a 12° bin. Direction is defined by the angle between the microsaccade vector and the x-axis of the screen coordinates (0° in the polar coordinates). The distribution in the “invisible” condition shows a smaller proportion of downward microsaccades (60.5%) than that in the “visible” condition (76.4%). About 2/3 of the microsaccades in the “physical disappearance” condition were downward (66.6%).
Figure 7
Figure 7
Directional microsaccade rate in three conditions (“invisible”, “visible” and “physical disappearance”). The directional rate was calculated in a window of 100 ms width moving in 1 ms steps as the difference between the rate of microsaccades directed upwards and the rate of microsaccades in the opposite direction. The figure shows the average directional microsaccade rates as a function of time. Shadows around the means indicate between-monkey confidence bands of ±1 SEM (n = 3). The horizontal dashed line represents the level of zero. The vertical red line represents the time stamp of surround onset. A positive value corresponds to the higher rate of upward microsaccades. A zero directional rate indicates that the rates of microsaccades in both directions are equal.

References

    1. Bair W, O’Keefe LP. The influence of fixational eye movements on the response of neurons in area MT of the macaque. Visual Neuroscience. 1998;15(4):779–786. - PubMed
    1. Betta E, Galfano G, Turatto M. Microsaccadic response during inhibition of return in a target-target paradigm. Vision Research. 2007;47(3):428–436. - PubMed
    1. Betta E, Turatto M. Are you ready? I can tell by looking at your microsaccades. Neuroreport. 2006;17(10):1001–1004. - PubMed
    1. Bonneh YS, Cooperman A, Sagi D. Motion-induced blindness in normal observers. Nature. 2001;411(6839):798–801. - PubMed
    1. Bridgeman B, Palca J. The role of microsaccades in high acuity observational tasks. Vision Research. 1980;20(9):813–817. - PubMed

Publication types