. 2009 Feb;80(2):226-39.
doi: 10.1016/j.biopsycho.2008.10.002. Epub 2008 Oct 21.

Same or different? Insights into the etiology of phonological awareness and rapid naming

Affiliations

Same or different? Insights into the etiology of phonological awareness and rapid naming

Adam J Naples et al. Biol Psychol. 2009 Feb.

Abstract

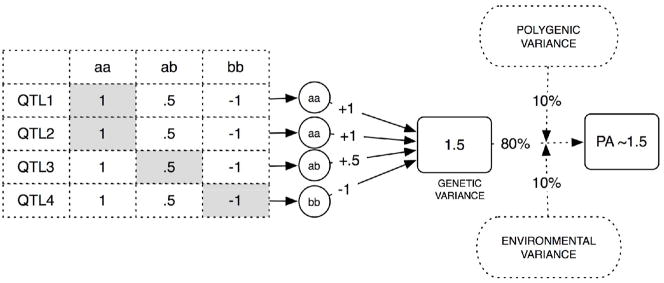
This work's objective was to offer additional insights into the psychological and genetic bases of reading ability and disability, and to evaluate the plausibility of a variety of psychological models of reading involving phonological awareness (PA) and rapid naming (RN), both hypothesized to be principal components in such models. In Study 1, 488 unselected families were assessed with measures of PA and RN to investigate familial aggregation and to obtain estimates of both the number and effect-magnitude of genetic loci involved in these traits' transmission. The results of the analyses from Study 1 indicated the presence of genetic effects in the etiology of individual differences for PA and RN and pointed to both the shared and unique sources of this genetic variance, which appeared to be exerted by multiple (3-6 for PA and 3-5 for RN) genes. These results were used in Study 2 to parameterize a simulation of 3000 families with quantitatively distributed PA and RN, so that the robustness and generalizability of the Study 1 findings could be evaluated. The findings of both studies were interpreted according to established theories of reading and our own understanding of the etiology of complex developmental disorders.


Figures

Figure 1
Figure 1. Theoretical models of unique and shared genetic etiologies of PA and RN
A. PA and RN are different manifestations of the same underlying process with a common/shared etiology. B. PA and RN are distinct processes with distinct etiologies. C. PA and RN are phenomenologically and etiologically partially overlapping processes.
Figure 2
Figure 2. Summaries of the segregation analyses
A. The steps of the histogram are from 0 to 10. The box plot in the corner shows the magnitude of effects of each of the genes, if present (when total genetic variance is constrained to 1). • Above the X axis: Number of genes contributing to PA when the trait is analyzed alone. • Below the X axis: Number of genes contributing to PA when the trait is analyzed in the presence of RN. B. The steps of the histogram are from 0 to 9. The box plot in the corner shows the magnitude of effects of each of the genes, if present (when total genetic variance is constrained to 1). • Above the X axis: Number of genes contributing to RN when the trait is analyzed alone. • Below the X axis: Number of genes contributing to RN when the trait is analyzed in the presence of PA.
Figure 3
Figure 3. Diagrams of the simulation scenarios. Circles show genes contributing to the traits uniquely. Diamonds depict shared genes
A. Simulation scenarios modeling different degrees of overlap among the genes contributing to PA and RN. B. Simulation scenarios modeling the “detectability” of genetic effects of different magnitudes. The magnitudes of genetic effects are shown with numbers.
Figure 4
Figure 4
An illustration of how trait values are generated. This illustration matches the first model in Figure 3A. In that model, four unique genes contribute to the variance in PA. For each gene, there is a numeric hypothetical phenotypic value associated with each specific genotype. In this example, an individual has the aa genotype at QTL1, the aa genotype at QTL2, the ab genotype in QTL3, and the bb genotype in QTL4. Each genotype contributes a value to the resulting PA value (shown by numbers). In addition, there are certain amounts of other variance (shown by letters e and p) that reflect polygenic and environmental contributions and noise.
Figure 5
Figure 5. Results from segregation analyses of the data generated in Study 2
A. Results of first simulation exercise. Box-and-whisker plots present the results of the segregation analyses for one trait (either PA or RN) by itself and then for both traits simultaneously, using simulated data created under scenarios 1–5 as shown in Figure 3A. The X axis shows the number of box-and-whisker plots: Plot #1 depicts the analyses for a single isolated trait; Plots 2–6 correspond to Models 1–5 as illustrated in Figure 3A. The Y axis shows the number of genes identified at least once in the course of 20,000 iterations. B. Results of the second simulation exercise (simulated scenarios shown in Figure 3B). The X axis shows the number of box-and-whisker plots: Plot 1 depicts the results of the segregation analyses for PA; Plot 5 depicts the results of the segregation analyses for RN; Plots 2–4 show the results of the analyses for PA when RN is regressed out (as per the simulation models shown in Figure 3B); Plots 6–8 show the results of the analyses for RN when PA is regressed out (as per the simulation models shown in Figure 3B). The Y axis shows the number of genes identified at least once in the course of 20,000 iterations.
Figure 6
Figure 6
Results from the linkage analyses of the data generated under Model 3 in the first simulation exercise. The results were generated with 20,000 iterations for all of the analyses; however, the results for the phenotype “RN covarying for PA” for chromosome 6 were generated with 200,000 iterations (to ensure that the results were indeed nil results). The vertical black line for each chromosome denotes the location of the “susceptibility” gene. Horizontal lines indicate the upper and lower boundaries for significant L-scores. The intensity of the shade captures the magnitude of the L-score (darker means stronger); the widths of the shade capture the precision with which the location of the signal can be established. The order of the strips is as follows: PA is the top strip, and then PA covarying for RN, then RN and then RN covarying for PA. The abbreviations C1–18 indicate chromosome numbers and QTL1–6 indicate contributing loci in the order in which they were selected at random from the list of eight candidate regions.

Similar articles

Cited by

References

    1. Ackerman PT, Dykman RA. Phonological processes, immediate memory, and confrontational naming in dyslexia. Journal of Learning Disabilities. 1993;26:597–609. - PubMed
    1. Ackerman PT, Dykman RA. The speed factor and learning disabilities: The toll of slowness in adolescents. Dyslexia: An International Journal of Research & Practice. 1996;2:1–21.
    1. Ackerman PT, Dykman RA, Oglesby D. Visual event-related potentials of dyslexic children to rhyming and nonrhyming stimuli. Journal of Clinical & Experimental Neuropsychology. 1994;16:138–154. - PubMed
    1. Ackerman PT, Holloway CA, Youngdahl PL, Dykman RA. The double-deficit theory of reading disability does not fit all. Learning Disabilities Research & Practice. 2001;16:152–160.
    1. Agnew JA, Dorn C, Eden GF. Effect of intensive training on auditory processing and reading skills. Brain and Language. 2004;88:21–25. - PubMed

Publication types

Substances

LinkOut - more resources