Accelerated failure time models provide a useful statistical framework for aging research
- PMID: 19007875
- PMCID: PMC2718836
- DOI: 10.1016/j.exger.2008.10.005
Accelerated failure time models provide a useful statistical framework for aging research
Abstract
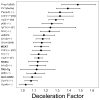
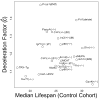
Survivorship experiments play a central role in aging research and are performed to evaluate whether interventions alter the rate of aging and increase lifespan. The accelerated failure time (AFT) model is seldom used to analyze survivorship data, but offers a potentially useful statistical approach that is based upon the survival curve rather than the hazard function. In this study, AFT models were used to analyze data from 16 survivorship experiments that evaluated the effects of one or more genetic manipulations on mouse lifespan. Most genetic manipulations were found to have a multiplicative effect on survivorship that is independent of age and well-characterized by the AFT model "deceleration factor". AFT model deceleration factors also provided a more intuitive measure of treatment effect than the hazard ratio, and were robust to departures from modeling assumptions. Age-dependent treatment effects, when present, were investigated using quantile regression modeling. These results provide an informative and quantitative summary of survivorship data associated with currently known long-lived mouse models. In addition, from the standpoint of aging research, these statistical approaches have appealing properties and provide valuable tools for the analysis of survivorship data.
Figures


Similar articles
-
OASIS: online application for the survival analysis of lifespan assays performed in aging research.PLoS One. 2011;6(8):e23525. doi: 10.1371/journal.pone.0023525. Epub 2011 Aug 15. PLoS One. 2011. PMID: 21858155 Free PMC article.
-
Deep Neural Network-Based Accelerated Failure Time Models Using Rank Loss.Stat Med. 2024 Dec 10;43(28):5331-5343. doi: 10.1002/sim.10235. Epub 2024 Oct 12. Stat Med. 2024. PMID: 39394866
-
A Reassessment of Genes Modulating Aging in Mice Using Demographic Measurements of the Rate of Aging.Genetics. 2018 Apr;208(4):1617-1630. doi: 10.1534/genetics.118.300821. Epub 2018 Feb 14. Genetics. 2018. PMID: 29444805 Free PMC article.
-
Can we develop genetically tractable models to assess healthspan (rather than life span) in animal models?J Gerontol A Biol Sci Med Sci. 2009 Feb;64(2):161-3. doi: 10.1093/gerona/gln067. Epub 2009 Feb 18. J Gerontol A Biol Sci Med Sci. 2009. PMID: 19225031 Free PMC article. Review.
-
Mouse models and aging: longevity and progeria.Curr Top Dev Biol. 2014;109:249-85. doi: 10.1016/B978-0-12-397920-9.00003-2. Curr Top Dev Biol. 2014. PMID: 24947239 Review.
Cited by
-
Immune responses accelerate ageing: proof-of-principle in an insect model.PLoS One. 2011;6(5):e19972. doi: 10.1371/journal.pone.0019972. Epub 2011 May 18. PLoS One. 2011. PMID: 21625631 Free PMC article.
-
Growth hormone-releasing hormone disruption extends lifespan and regulates response to caloric restriction in mice.Elife. 2013 Oct 29;2:e01098. doi: 10.7554/eLife.01098. Elife. 2013. PMID: 24175087 Free PMC article.
-
Multiple chronic condition profiles and survival among oldest-old male patients with hip fracture.Arch Gerontol Geriatr. 2018 Jan;74:184-190. doi: 10.1016/j.archger.2017.10.014. Epub 2017 Oct 28. Arch Gerontol Geriatr. 2018. PMID: 29126081 Free PMC article.
-
Endocytic coelomocytes are required for lifespan extension by axenic dietary restriction.PLoS One. 2023 Jun 27;18(6):e0287933. doi: 10.1371/journal.pone.0287933. eCollection 2023. PLoS One. 2023. PMID: 37368903 Free PMC article.
-
Pharmacokinetic Modeling and Model-Based Hypothesis Generation for Dose Optimization of Clonidine in Neonates With Neonatal Opioid Withdrawal Syndrome.Clin Pharmacol Ther. 2025 May;117(5):1254-1263. doi: 10.1002/cpt.3507. Epub 2024 Nov 22. Clin Pharmacol Ther. 2025. PMID: 39575611 Free PMC article. Clinical Trial.
References
-
- Abrahamowicz M, MacKenzie T, Esdaile JM. Time-dependent hazard ratio: modeling and hypothesis testing with application in lupus nephritis. J Amer Statist Assoc. 1996;91:1432–1439.
-
- Akaike A. A new look at the statistical model identification. IEEE Trans Autom Control. 1974;19:716–723.
-
- Barrodale I, Roberts F. Solution of an overdetermined system of equations in the ℓ1 norm. Communications of the ACM. 1974;17:319–320.
-
- Baur JA, Pearson KJ, Price NL, Jamieson HA, Lerin C, Kalra A, Prabhu VV, Allard JS, Lopez-Lluch G, Lewis K, Pistell PJ, Poosala S, Becker KG, Boss O, Gwinn D, Wang M, Ramaswamy S, Fishbein KW, Spencer RG, Lakatta EG, Le Couteur D, Shaw RJ, Navas P, Puigserver P, Ingram DK, de Cabo R, Sinclair DA. Resveratrol improves health and survival of mice on a high-calorie diet. Nature. 2006;444:337–342. - PMC - PubMed
Publication types
MeSH terms
Grants and funding
LinkOut - more resources
Full Text Sources
Medical
Molecular Biology Databases

