. 2009 Feb;21(2):264-73.
doi: 10.1016/j.cellsig.2008.10.014. Epub 2008 Oct 29.

Glycogen synthase kinase-3 regulates microglial migration, inflammation, and inflammation-induced neurotoxicity

Affiliations

Glycogen synthase kinase-3 regulates microglial migration, inflammation, and inflammation-induced neurotoxicity

Christopher J Yuskaitis et al. Cell Signal. 2009 Feb.

Abstract

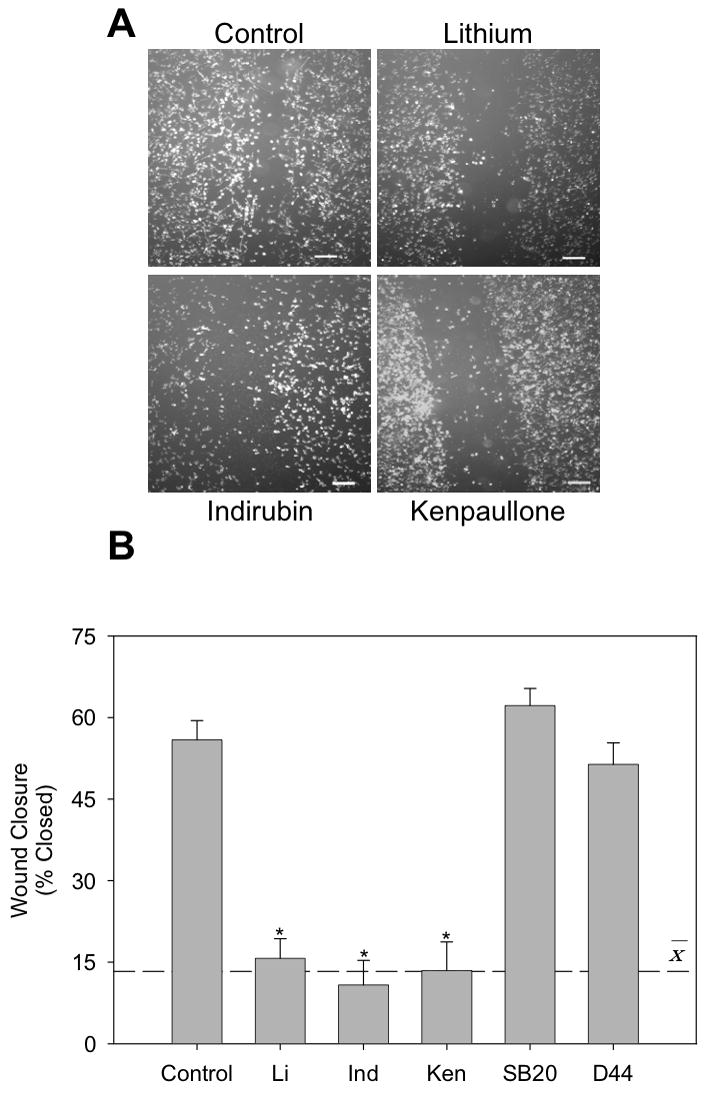
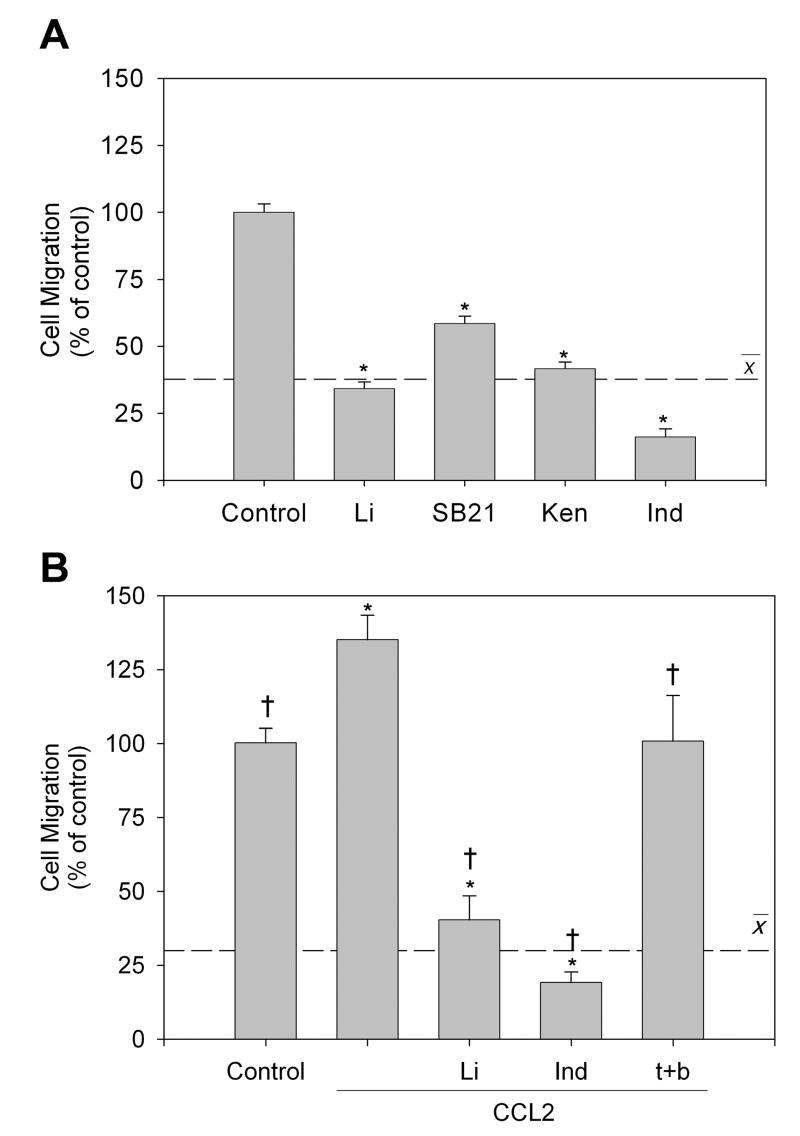
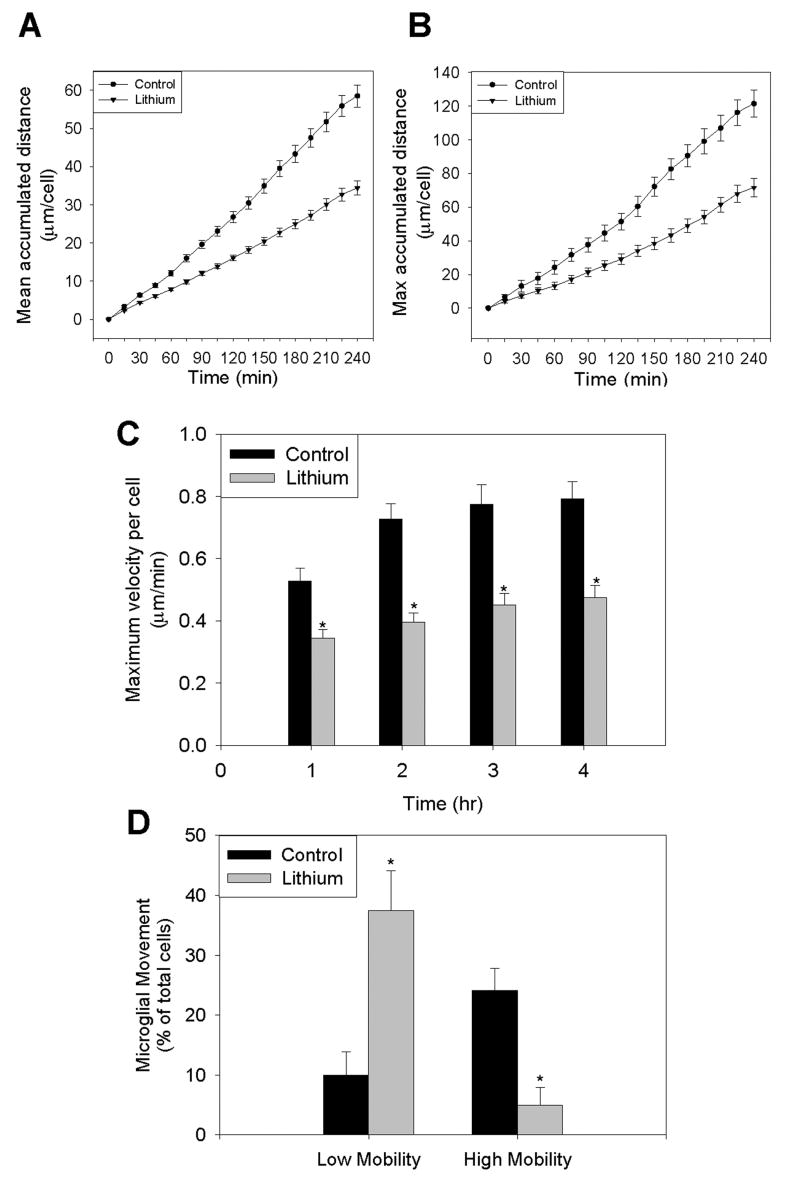
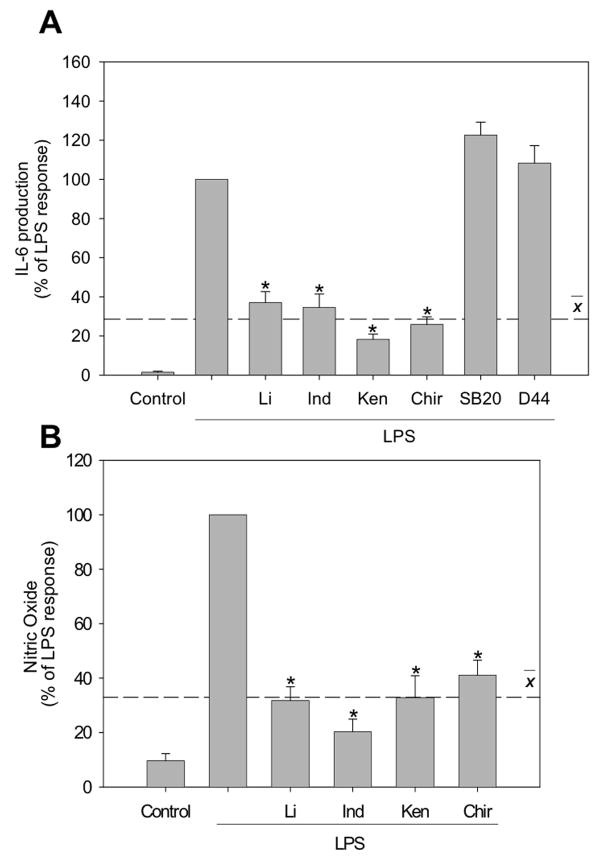
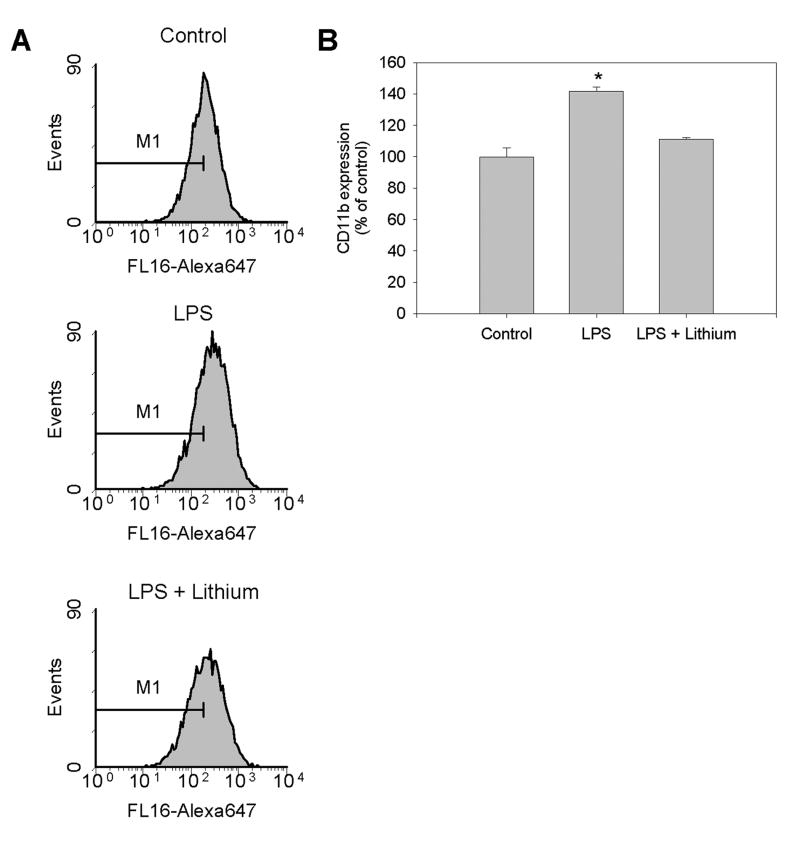
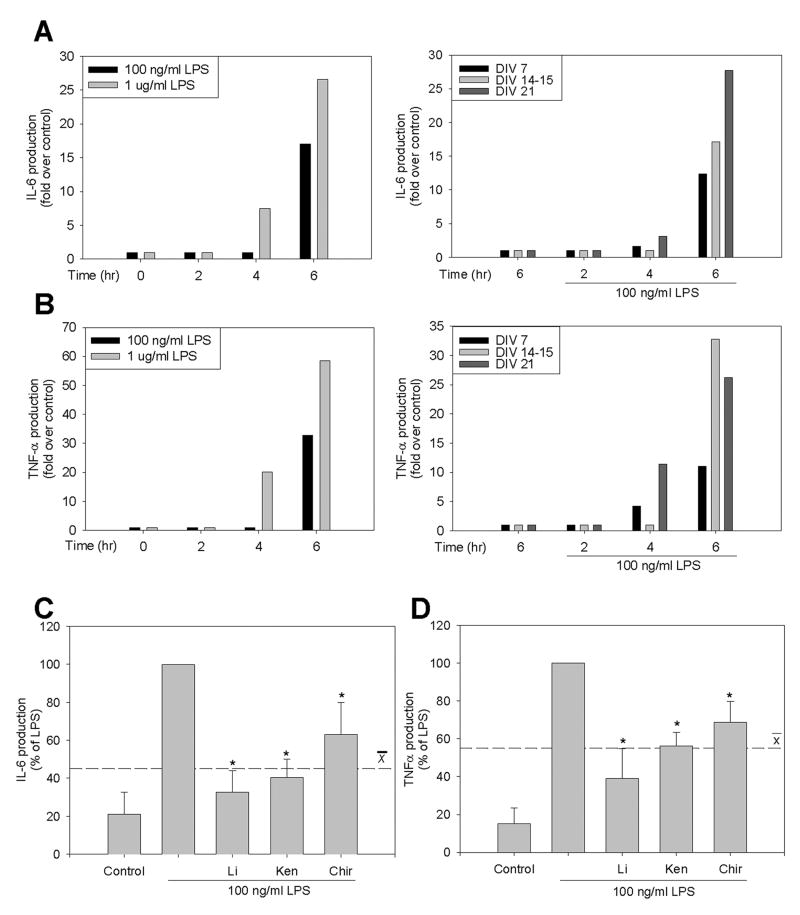
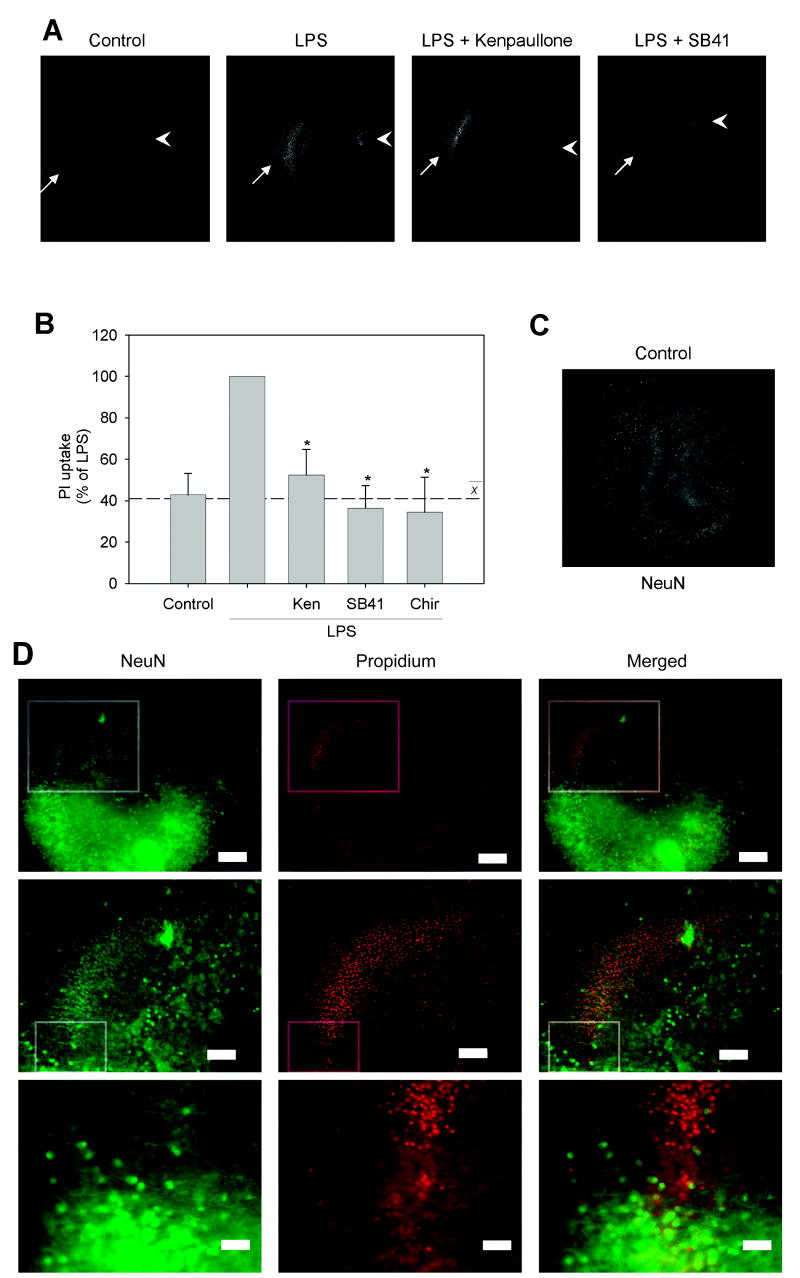
Microglia play a prominent role in the brain's inflammatory response to injury or infection by migrating to affected locations, secreting inflammatory molecules, and phagocytosing damaged tissue. However, because severe or chronic neuroinflammation exacerbates many neurological conditions, controlling microglia actions may provide therapeutic benefits in a diverse array of diseases. Since glycogen synthase kinase-3 (GSK3) promotes inflammatory responses in peripheral immune cells, we investigated if inhibitors of GSK3 attenuated microglia responses to inflammatory stimuli. Treatment of BV-2 microglia with GSK3 inhibitors greatly reduced the migration of microglia in both a scratch assay and in a transwell migration assay. Treatment of BV-2 microglia with lipopolysaccharide (LPS) stimulated the production of interleukin-6 and increased the expression of inducible nitric oxide synthase (iNOS) and NO production. Each of these microglia responses to inflammatory stimulation were greatly attenuated by GSK3 inhibitors. However, GSK3 inhibitors did not cause a general impairment of microglia functions, as the LPS-induced stimulated expression of cyclooxygenase-2 was unaltered. Regulation of microglia functions were also evident in cultured mouse hippocampal slices where GSK3 inhibitors reduced cytokine production and microglial migration, and provided protection from inflammation-induced neuronal toxicity. These findings demonstrate that GSK3 promotes microglial responses to inflammation and that the utilization of GSK3 inhibitors provides a means to limit the inflammatory actions of microglia.


Figures

Figure 1
Figure 1. GSK3 inhibitors reduce migration of microglia in vitro
In the scratch migration assay, BV-2 microglia were preincubated for 30 min with GSK3 inhibitors 20 mM lithium (Li), 10 μM indirubin-3’-monoxime (Ind), or 10 μM kenpaullone (Ken), or with non-GSK3 kinase inhibitors 10 μM SB203580 and 10 μM D4476. The scratch was implemented and the cells were imaged immediately and after incubation for 6 hr. (A) Representative images at 6 hr after scratching (scale bar = 200 μm). (B) Wound closure was calculated by dividing widths measured after a 6 hr incubation by the initial scrape width. Values are Means ± SEM; n=3; the dashed line represents the average response with the three GSK3 inhibitors. *p<0.05 compared with control in the absence of GSK3 inhibitor.
Figure 2
Figure 2. GSK3 inhibitors attenuate random and directed microglial migration in vitro
(A) Random migration of BV-2 microglia to the bottom of a transwell migration chamber was measured after treatment with GSK3 inhibitors 20 mM lithium (Li), 10 μM SB216763 (SB21), 10 μM kenpaullone (Ken), or 10 μM indirubin-3’-monoxime (Ind) after a 6 hr incubation. (B) Chemotaxis of BV-2 microglia towards 50 μM CCL2 in the bottom chamber was measured with or without GSK3 inhibitors for 6 hr. The chemotactic gradient was abolished by incubating with CCL2 in the top and bottom (CCL2 t+b) chambers. Control values averaged 34 ± 5 cells per field of view, with 9 high-power fields counted per well. Values are Means ± SEM; n = 3 wells per group in at least 3 independent experiments; the dashed line represents the average response with the GSK3 inhibitors. *p<0.05 compared with untreated control cells; †p<0.05 compared with CCL2-treated cells in the absence of GSK3 inhibitor.
Figure 3
Figure 3. Lithium attenuates injury-induced migration of microglia in situ
Microglial movements in acute hippocampal slices prepared from CX3CR1+/GFP heterozygous mice were measured every 5 min for 4 hr with or without incubation with the GSK3 inhibitor 20 mM lithium. (A) The accumulated migration distance of all microglia counted per slice for each treatment. (B) The accumulated migration distance of the 10% microglia moving the farthest per slice. (C) The maximum velocity calculated at each hour of all microglia counted per treatment. (D) The percentage of microglia per slice migrating less than 25 μm (low mobility) and greater than 75 μm (high mobility) during a 4 hr period after an initial 1 hr equilibration. Values are Means ± SEM; n=3 slices with 40 cells per slice counted; *p<0.05 compared with control in the absence of GSK3 inhibitor.
Figure 4
Figure 4. GSK3 promotes IL-6 and nitric oxide production
(A) BV-2 microglia were preincubated for 30 min with GSK3 inhibitors 20 mM lithium (Li), 10 μM indirubin-3’-monoxime (Ind), 10 μM kenpaullone (Ken), or 10 μM CHIR99021 (Chir), or with non-GSK3 kinase inhibitors 10 μM SB203580 and 10 μM D4476, followed by treatment with 100 ng/ml LPS for 6 hr and released IL-6 was measured. (B) BV-2 microglia were preincubated for 30 min with GSK3 inhibitors 20 mM Li, 10 μM Ind, 10 μM Ken, or 10 μM Chir, followed by treatment with 1 μg/ml LPS for 24 hr and nitrite, the stable breakdown product of NO, was measured. LPS stimulated the production 227 ± 51 pg/ml of IL-6 and 46 ± 6 μM NO. Values are Means ± SEM; n=3; the dashed line represents the average response with the GSK3 inhibitors present. *p<0.05 compared with LPS treatment in the absence of GSK3 inhibitor.
Figure 5
Figure 5. GSK3 selectively promotes iNOS, but not COX-2, expression after LPS stimulation
BV-2 microglia were stimulated with 100 ng/ml LPS for 6 hr after preincubation for 30 min with GSK3 inhibitors 20 mM lithium (Li), 10 μM indirubin-3’-monoxime (Ind), 10 μM kenpaullone (Ken), or 10 μM CHIR99021 (Chir), or with 10 μM roscovitine (Ros), as indicated. Representative immunoblots of (A) iNOS and (C) COX-2 and (B and D) quantified measurements from three independent experiments are shown. (E) iNOS and (F) COX-2 levels were measured after preincubation with the GSK3 inhibitor Ind or with non-GSK3 kinase inhibitors 10 μM SB203580 and 10 μM D4476 for 30 min followed by stimulation with LPS for 6 hr. Values are Means ± SEM; n=3; the dashed line represents the average response with the GSK3 inhibitors. *p<0.05 compared with LPS treatment in the absence of inhibitor.
Figure 6
Figure 6. GSK3 regulates LPS-induced upregulation of CD11b
BV-2 microglia were stimulated with 100 ng/ml LPS for 24 hr after preincubation for 30 min with the GSK3 inhibitor 20 mM lithium, followed by analysis of CD11b surface expression by flow cytometry. (A) Representative flow cytometry profiles. (B) Quantitative values are percent (± SEM) of control geographic mean; n=5; *p<0.05 compared with control untreated cells.
Figure 7
Figure 7. GSK3 promotes microglial cytokine production in situ
Organotypic hippocampal slice cultures (HSCs) exhibited concentration-, time-, and days in vitro (DIV)-dependent increases of (A) IL-6 and (B) TNF-α after LPS stimulation. (C) IL-6 and (D) TNF-α were measured by ELISA after preincubation of HSCs for 30 min with GSK3 inhibitors 20 mM lithium (Li), 10 μM kenpaullone (Ken), or 10 μM CHIR99021 (Chir) followed by treatment with 100 ng/ml LPS for 6 hr. LPS stimulated the production of 575 ± 191 pg/ml IL-6 and 169 ± 56 pg/ml TNF-α. Values are presented as percent of LPS stimulation. Means ± SEM; n=12 (4 slices per well from three different mice in three different experiments); the dashed line represents the average response with the three GSK3 inhibitors. *p<0.05 compared with LPS treatment in the absence of GSK3 inhibitor.
Figure 8
Figure 8. GSK3 inhibitors protect from inflammation-induced neurotoxicity in situ
Organotypic hippocampal slice cultures (HSCs) were pretreated with GSK3 inhibitors, 10 μM kenpaullone (Ken), 10 μM SB415286 (SB41), or 10 μM CHIR99021 (Chir) for 30 min, followed by 100 ng/ml LPS stimulation for 24 hr, then HSCs were incubated with 13 μM propidium iodide (PI) for 20 min and PI uptake was measured. (A) Representative images of PI-stained HSCs with CA1 (arrows) and dentate gyrus (arrowheads) indicated. (B) Quantified PI intensity from HSCs. Values are Means ± SEM; n = 12 (4 slices per well from three different mice in three different experiments); the dashed line represents the average response with the three GSK3 inhibitors. *p<0.05 compared with LPS treatment in the absence of GSK3 inhibitor. HSC neurons stained with NeuN (C) in control conditions and (D) after LPS treatment show loss of NeuN staining in the CA1/subiculum region (top row box) corresponding with an increase in PI-stained cells. Top row shows 5 x magnification (scale bar = 200 μm) and middle row shows inset from boxed region at 10 x magnification (scale bar = 100 μm). Bottom row shows inset from middle row at 20 x magnification (scale bar = 50 μm) indicating the transition between healthy, NeuN-positive neurons and dead, PI-labeled neurons.

References

    1. Davalos D, Grutzendler J, Yang G, Kim JV, Zuo Y, Jung S, Littman DR, Dustin ML, Gan WB. Nat Neurosci. 2005;8:752. - PubMed
    1. Nimmerjahn A, Kirchhoff F, Helmchen F. Science. 2005;308:1314. - PubMed
    1. Ladeby R, Wirenfeldt M, Garcia-Ovejero D, Fenger C, Dissing-Olesen L, Dalmau I, Finsen B. Brain Res Rev. 2005;48:196. - PubMed
    1. Hanisch UK, Kettenmann H. Nat Neurosci. 2007;10:1387. - PubMed
    1. Kim SU, de Vellis J. J Neurosci Res. 2005;81:302. - PubMed

Publication types

MeSH terms