

Stimulation of mammalian G-protein-responsive adenylyl cyclases by carbon dioxide
- PMID: 19008230
- PMCID: PMC2613629
- DOI: 10.1074/jbc.M807239200
Stimulation of mammalian G-protein-responsive adenylyl cyclases by carbon dioxide
Abstract
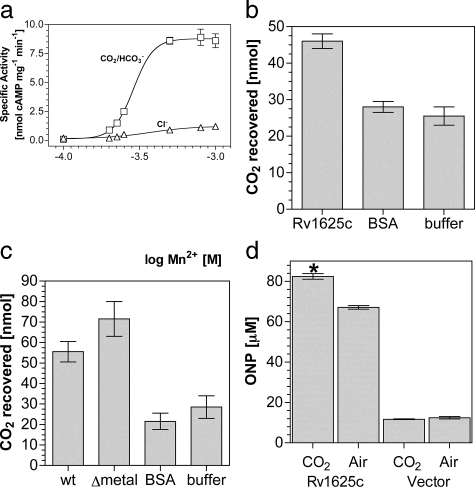
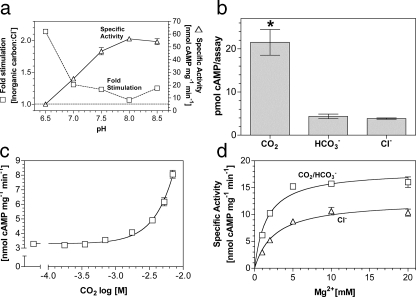
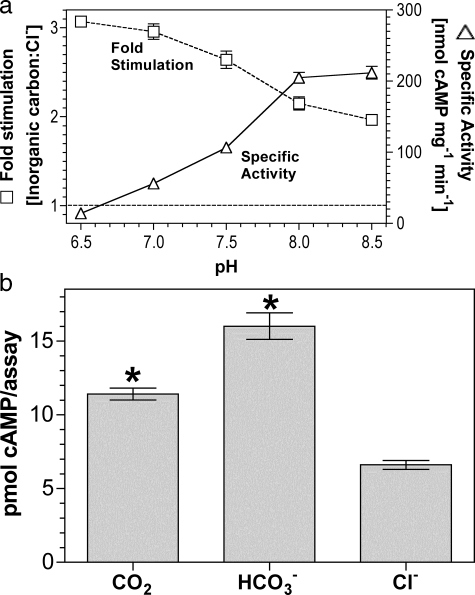
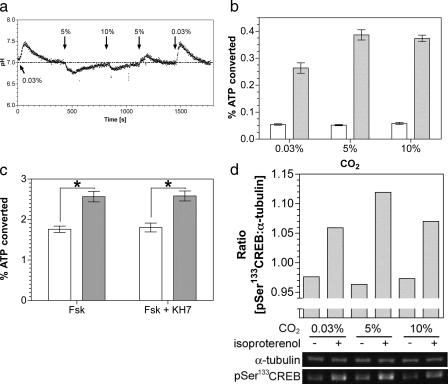
Carbon dioxide is fundamental to the physiology of all organisms. There is considerable interest in the precise molecular mechanisms that organisms use to directly sense CO(2). Here we demonstrate that a mammalian recombinant G-protein-activated adenylyl cyclase and the related Rv1625c adenylyl cyclase of Mycobacterium tuberculosis are specifically stimulated by CO(2). Stimulation occurred at physiological concentrations of CO(2) through increased k(cat). CO(2) increased the affinity of enzyme for metal co-factor, but contact with metal was not necessary as CO(2) interacted directly with apoenzyme. CO(2) stimulated the activity of both G-protein-regulated adenylyl cyclases and Rv1625c in vivo. Activation of G-protein regulated adenylyl cyclases by CO(2) gave a corresponding increase in cAMP-response element-binding protein (CREB) phosphorylation. Comparison of the responses of the G-protein regulated adenylyl cyclases and the molecularly, and biochemically distinct mammalian soluble adenylyl cyclase revealed that whereas G-protein-regulated enzymes are responsive to CO(2), the soluble adenylyl cyclase is responsive to both CO(2) and bicarbonate ion. We have, thus, identified a signaling enzyme by which eukaryotes can directly detect and respond to fluctuating CO(2).
Figures

Similar articles
-
Inhibition of cloned adenylyl cyclases by mutant-activated Gi-alpha and specific suppression of type 2 adenylyl cyclase inhibition by phorbol ester treatment.J Biol Chem. 1993 Jun 15;268(17):12253-6. J Biol Chem. 1993. PMID: 8389756
-
A defined subset of adenylyl cyclases is regulated by bicarbonate ion.J Biol Chem. 2003 Sep 12;278(37):35033-8. doi: 10.1074/jbc.M303025200. Epub 2003 Jun 26. J Biol Chem. 2003. PMID: 12829712
-
Conservation of functional domain structure in bicarbonate-regulated "soluble" adenylyl cyclases in bacteria and eukaryotes.Dev Genes Evol. 2004 Oct;214(10):503-9. doi: 10.1007/s00427-004-0432-2. Epub 2004 Aug 20. Dev Genes Evol. 2004. PMID: 15322879 Free PMC article.
-
Structure, mechanism, and regulation of soluble adenylyl cyclases - similarities and differences to transmembrane adenylyl cyclases.Biochim Biophys Acta. 2014 Dec;1842(12 Pt B):2535-47. doi: 10.1016/j.bbadis.2014.08.012. Epub 2014 Sep 2. Biochim Biophys Acta. 2014. PMID: 25193033 Review.
-
The class III adenylyl cyclases: multi-purpose signalling modules.Cell Signal. 2003 Dec;15(12):1081-9. doi: 10.1016/s0898-6568(03)00130-x. Cell Signal. 2003. PMID: 14575863 Review.
Cited by
-
Novel inhibitors of cholesterol degradation in Mycobacterium tuberculosis reveal how the bacterium's metabolism is constrained by the intracellular environment.PLoS Pathog. 2015 Feb 12;11(2):e1004679. doi: 10.1371/journal.ppat.1004679. eCollection 2015 Feb. PLoS Pathog. 2015. PMID: 25675247 Free PMC article.
-
Hypercapnia modulates cAMP signalling and cystic fibrosis transmembrane conductance regulator-dependent anion and fluid secretion in airway epithelia.J Physiol. 2016 Mar 15;594(6):1643-61. doi: 10.1113/JP271309. Epub 2015 Dec 20. J Physiol. 2016. PMID: 26574187 Free PMC article.
-
Crystal structure and regulation mechanisms of the CyaB adenylyl cyclase from the human pathogen Pseudomonas aeruginosa.J Mol Biol. 2012 Feb 17;416(2):271-86. doi: 10.1016/j.jmb.2011.12.045. Epub 2011 Dec 28. J Mol Biol. 2012. PMID: 22226839 Free PMC article.
-
Bicarbonate-sensitive soluble and transmembrane adenylyl cyclases in peripheral chemoreceptors.Respir Physiol Neurobiol. 2013 Aug 15;188(2):83-93. doi: 10.1016/j.resp.2013.05.013. Epub 2013 May 31. Respir Physiol Neurobiol. 2013. PMID: 23727159 Free PMC article.
-
Carbon dioxide-dependent signal transduction in mammalian systems.Interface Focus. 2021 Apr 6;11(2):20200033. doi: 10.1098/rsfs.2020.0033. Epub 2021 Feb 12. Interface Focus. 2021. PMID: 33633832 Free PMC article. Review.
References
-
- Falkowski, P. G., and Raven, J. A. (2007) Aquatic Photosynthesis, 2nd Ed., pp. 156–200, Princeton University Press, Princeton
-
- Roos, A., and Boron, W. F. (1981) Physiol. Rev. 61 296–434 - PubMed
-
- Smith, K. S., and Ferry, J. G. (2000) FEMS Microbiol. Rev, 24 335–366 - PubMed
-
- Bahn, Y. S., and Muhlschlegel, F. A. (2006) Curr. Opin. Microbiol. 9 572–578 - PubMed
Publication types
MeSH terms
Substances
Grants and funding
LinkOut - more resources
Full Text Sources
Molecular Biology Databases
Miscellaneous
