. 2009 Jan 23;284(4):2138-49.
doi: 10.1074/jbc.M805530200. Epub 2008 Nov 12.

Switch 1 mutation S217A converts myosin V into a low duty ratio motor

Affiliations

Switch 1 mutation S217A converts myosin V into a low duty ratio motor

Eva Forgacs et al. J Biol Chem. .

Abstract

We have determined the kinetic mechanism and motile properties of the switch 1 mutant S217A of myosin Va. Phosphate dissociation from myosin V-ADP-Pi (inorganic phosphate) and actomyosin V-ADP-Pi and the rate of the hydrolysis step (myosin V-ATP-->myosin V-ADP-Pi) were all approximately 10-fold slower in the S217A mutant than in wild type (WT) myosin V, resulting in a slower steady-state rate of basal and filamentous actin (actin)-activated ATP hydrolysis. Substrate binding and ADP dissociation kinetics were all similar to or slightly faster in S217A than in WT myosin V and mechanochemical gating of the rates of dissociation of ADP between trail and lead heads is maintained. The reduction in the rate constants of the hydrolysis and phosphate dissociation steps reduces the duty ratio from approximately 0.85 in WT myosin V to approximately 0.25 in S217A and produces a motor in which the average run length on actin at physiological concentrations of ATP is reduced 10-fold. Thus we demonstrate that, by mutational perturbation of the switch 1 structure, myosin V can be converted into a low duty ratio motor that is processive only at low substrate concentrations.


Figures

FIGURE 1.
FIGURE 1.
Schematic representation of the critical residues in the ATP binding site of myosin based on the MgADP·VO4 crystal of the Dictyostelium motor domain (Smith and Rayment (30)). The serine in position 217 was mutated to alanine for these kinetic studies. The small spheres are at the position of the oxygen of the water molecules.
FIGURE 2.
FIGURE 2.
Stopped-flow titration of the Myosin V-S1(S217A) mutant with deac-aminoATP. Single and multiple turnover stopped-flow measurements were performed by mixing myosin V-S1(S217A) with increasing concentrations of deac-aminoATP. Final concentrations in the cell were 0.12 μm myosin V-S1(S217A), 0.09, 0.18, and 0.36 μm deac-aminoATP, 25 mm KCl, 10 mm MOPS, 3 mm MgCl2, 1 mm EGTA, pH 7.5, 20 °C. The lines through the data points are global fits to rate constants kT = 3.2 μm-1s-1, k-DAP = 0.0055 s-1.
FIGURE 3.
FIGURE 3.
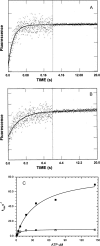
ATP binding and hydrolysis measured by tryptophan fluorescence. A, the increase in tryptophan fluorescence observed upon mixing WT myosin V-S1 with ATP. The solid line through the data is the fit to a single exponential equation with a kobs value of 44.1 s-1. Experimental conditions were: 0.9 μm myosin V-S1, 35.8 μm ATP, 25 mm KCl, 10 mm MOPS, 3 mm MgCl2, 1 mm EGTA, pH 7.5, 20 °C. B, conditions were similar to those in A except that myosin V-S1(S217A) was used. The data were fit to a single exponential equation with a kobs value of 7.8 s-1. C, dependence of the observed rate of binding to WT (▪) and myosin V-S1(S217A) (□) upon ATP concentration. Experimental conditions were similar to those in A and B except that the final ATP concentration was varied as indicated. The data are fit to hyperbolas (kobs = kmax/(1 + [ATP]/Kapp) with a kmax of 84 ± 6 s-1 and Kapp of 37 ± 7 μm for WT and a kmax of 9.9 ± 0.6 s-1 and Kapp of 3.8 ± 0.9 μm for S217A.
FIGURE 4.
FIGURE 4.
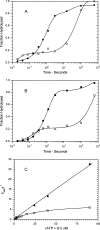
Measurement of ATP hydrolysis by rapid chemical quench. WT myosin V-S1 (A) and myosin V-S1(S217A) (B) were mixed with ATP, allowed to react for the indicated amount of time, and then quenched with acid as described under “Experimental Procedures.” Final concentrations in the delay line were 4 μm myosin V-S1 and 1 μm ATP (•, ▪) or 8 μm S1 and 32 μm ATP (○, □). The solid lines through the data are fits to double exponential equations: A, I(t) = 0.93 - (0.74e-1.1 t + 0.18e-0.03 t) (•) and I(t) = 1.0 - (0.18e-13 t + 0.72e-0.02 t) (○); B, I(t) = 1.0 - (0.84e-0.85 t + 0.17e-0.003 t) (▪) and I(t) = 0.97 - (0.22e6.0+t + 0.75e-0.0023 t) (□). C, dependence of the observed rates of hydrolysis upon ATP and S1 concentration. Experiments were similar to those described in A and B except that the ATP and protein concentrations were varied as indicated. At [S1 + ATP] < 10 μm, [S1] = 4 × [ATP] and at [S1+ATP] >10 μm, [ATP] = 4 × [S1]. WT myosin V-S1 (▪) are fit by a straight line with a slope of 0.33 ± 0.02 μm-1s-1. Myosin V(S217A) (□) were fit by a hyperbolic equation in which kmax = 8.2 ± 1 s-1 and Kapp = 36 ± 5 μm.
FIGURE 5.
FIGURE 5.
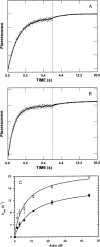
Kinetics of phosphate dissociation from the (acto)myosin V-ADP-Pi complex. Double mixing stopped-flow experiments using MDCC-PBP were performed as described under “Experimental Procedures.” Myosin V-S1(S217A) was first mixed with ATP, held in a delay line for 20 s, and then mixed with actin to accelerate Pi release. Final concentrations in the flow cell were 0.8 μm myosin V, 0.4 μm ATP, 0–44 μm actin, 1 mm EGTA, 3 mm MgCl2, 10 mm MOPS, 25 mm KCl, 10 μm MDCC-PBP, 0.1 mm 7-methylguanosine, and 0.01 unit/ml purine-nucleoside phosphorylase, pH 7.5, 20 °C. Phosphate dissociation from myosin V-S1(S217A)-ADP-Pi (A) and myosin V-HMM(S217A)-ADP-Pi (B) complexes in the presence 11.2 μm actin is shown. The solid line through the data is the best fit to a double exponential equation: I(t) =-(0.19e-8.8 t + 0.02e-0.23 t) + C for panel A and I(t) =-(0.06e-13.9 t + 0.006e-0.21 t) + C for panel B. C, dependence of kobs for phosphate dissociation upon actin concentration were fit by a hyperbolic equation: kobs = kmax/(1 + Kapp/[actin]) when kmax = 16 ± 1.6 s-1 and Kapp = 9.4 ± 2.6 μm for the myosin V-S1(S217A) (▪) and kmax = 20.9 ± 1.1 s-1 and Kapp = 5.3 ± 0.9 μm for the myosin V-HMM(S217A) (□).
FIGURE 6.
FIGURE 6.
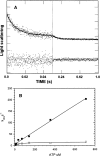
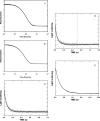
ATP induced dissociation of myosin V-S1(S217A) from actin. A, the upper curve shows the decrease in light scattering observed upon mixing actomyosin V-S1(S217A) with ATP. The solid line through the data is a fit to I(t) = 0.05e-112+t + 0.01e-10.2 t + C. The lower curve was obtained by mixing actin alone with ATP. Experimental conditions in the flow cell were: 0.5 μm myosin V-S1(S217A), 5.0 μm actin, and 358 μm ATP (final concentrations in the cell), 25 mm KCl, 10 mm MOPS, 3 mm MgCl2, 1 mm EGTA, pH 7.5, 20 °C. B, experimental conditions were the same as in A except that the ATP concentrations were varied from 7 to 714 μm. The fast rates (▪) were fit by a linear equation with a slope of 0.29 μm-1s-1, and the slow rates (□) were fit by a hyperbolic equation in which kmax = 18 ± 7 s-1, Kapp = 71 ± 93 μm.
FIGURE 7.
FIGURE 7.
Kinetics of nucleoside diphosphate dissociation from the myosin V-S1(S217A) and actomyosin V-S1(S217A)-ADP complexes. A, a solution containing myosin V-S1(S217A) and deac-aminoADP was mixed with ATP in the stopped-flow apparatus. Final concentrations in the flow cell were: 0.3 μm myosin V-S1(S217A), 1.4 μm deac-aminoADP, 1.42 mm ATP, 25 mm KCl, 10 mm MOPS, 3 mm MgCl2, 1 mm EGTA, pH 7.5, 20 °C. The decrease in fluorescence was fit by a single exponential with a kobs = 0.86 s-1. B, conditions were similar to those in A except that the initial actomyosin V-S1(S217A)-deacaminoADP was formed by the addition of 14.2 μm phalloidin-actin. The data were fit by a single exponential equation in which kobs = 1.34 s-1, C–E, the dissociation of ADP, deoxymantADP, and deac-aminoADP from actomyosin V-S1(S217A) was measured from the decrease in light scattering observed upon mixing the actomyosin V-S1(S217A) nucleotide diphosphate complexes with ATP. The solid lines through the data correspond to a kobs of 17, 20, and 0.93 s-1 for the dissociation of ADP, deoxymantADP, and deac-aminoADP, respectively. Final concentrations in the flow cell were 0.3 μm myosin V-S1(S217A), 1.42 μm nucleoside diphosphate, 0.7 μm phalloidin-actin, 0.7 mm ATP, 25 mm KCl, 10 mm MOPS, 3 mm MgCl2, 1 mm EGTA, pH 7.5, 20 °C.
FIGURE 8.
FIGURE 8.
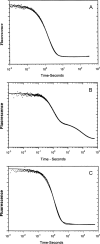
Product dissociation from the actomyosin V-S1(S217A) and actomyosin V-HMM(S217A)-deac-aminoADP-Pi complexes. A, myosin V-HMM(S217A) was mixed with 1 μm deac-aminoATP, held for 20 s in a delay line, and then mixed with phalloidin-actin and ATP. Experimental conditions: 25 mm KCl, 10 mm MOPS, 3 mm MgCl2, 1 mm EGTA, pH 7.5, 20 °C. Final concentrations in the cell: 0.3 μm myosin V-HMM(S217A) active sites, 0.3 μm deac-aminoATP, 11.1 μm actin, and 1.1 mm ATP. The solid line through the data is the best fit to a single exponential equation: I(t) = 0.65e-0.64 t + C. B, experimental conditions were similar to those in A except that a hexokinase-treated ADP chase replaced ATP: I(t) = 0.38e-0.80 t + 0.18e-0.010t + C. C, experimental conditions were similar to those in B except that myosin V-S1(S217A) replaced myosin V-HMM(S217A): I(t) = 0.647e-0.74 t + C.
FIGURE 9.
FIGURE 9.
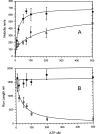
Single molecule motility assay with WT myosin V-HMM and myosin V-HMM(S217A). Calmodulin was labeled with Alexa Fluor 568 and exchanged for endogenous calmodulins into myosin V-HMM, and the molecule was observed using a 532 nm diode laser. Experimental conditions: 40 mm KCl, 20 mm MOPS, 4 mm MgCl2, 0.1 mm EGTA, 1 μm calmodulin, 50 mm dithiothreitol, and various concentrations of ATP as indicated at pH 7.5, 25 °C. The reactions also included an oxygen scavenging system composed of 25 μg/ml glucose oxidase, 45 μg/ml catalase, and 2.5 mg/ml glucose. A, velocity was measured for the movement of WT myosin V-HMM (▪) and myosin V-HMM(S217A) (□) on actin at various ATP concentrations. The maximum velocity was 695 nm/s for WT and 485 nm/s for S217A. B, run length of WT myosin V-HMM (▪) and myosin V-HMM(S217A) (□) at various ATP concentrations. Each data point was obtained by fitting a histogram of the run lengths with a single exponential.
FIGURE 10.
FIGURE 10.
Comparison of the mechanisms of processive movement by WT myosin V and myosin V(S217A) on actin. Actin is depicted by a red bar. Myosin V is moving from left to right. T = ATP, P = phosphate, and D = ADP. Rate constants measured in this work for myosin V(S217A), which have been observed to be significantly different than WT, are shown in green and can be compared with rate constants for WT myosin V, shown in black. Second order binding of ATP to myosin is indicated by [ATP]. Rate constants, shown by single arrows, are either rapid (>1000 s-1) or differ by less than a factor of 2 for WT and S217A.

References

    1. Odronitz, F., and Kollmar, M. (2007) Genome Biol. 8 R196. - PMC - PubMed
    1. Sellers, J. R., and Veigel, C. (2006) Curr. Opin. Cell Biol. 18 68-73 - PubMed
    1. Wu, X., Bowers, B., Wei, Q., Kocher, B., and Hammer, J. A., III (1997) J. Cell Sci. 110 847-859 - PubMed
    1. Mehta, A. D., Rock, R. S., Rief, M., Spudich, J. A., Mooseker, M. S., and Cheney, R. E. (1999) Nature 400 590-593 - PubMed
    1. Yildiz, A., Forkey, J. N., McKinney, S. A., Ha, T., Goldman, Y. E., and Selvin, P. R. (2003) Science 300 2061-2065 - PubMed

Publication types