. 2009 Mar;8(3):558-70.
doi: 10.1074/mcp.M800165-MCP200. Epub 2008 Nov 13.

Urine metabolomics analysis for kidney cancer detection and biomarker discovery

Affiliations

Urine metabolomics analysis for kidney cancer detection and biomarker discovery

Kyoungmi Kim et al. Mol Cell Proteomics. 2009 Mar.

Abstract

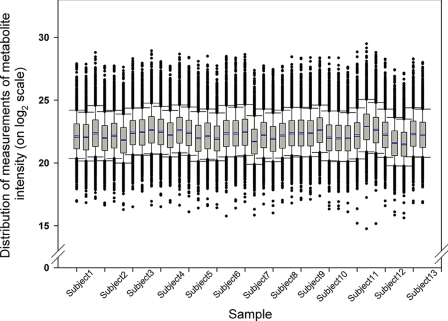
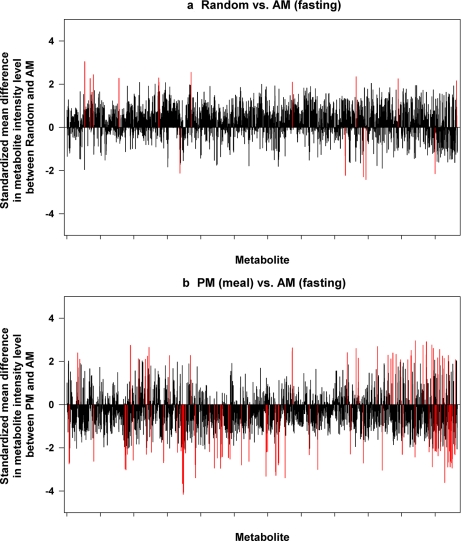
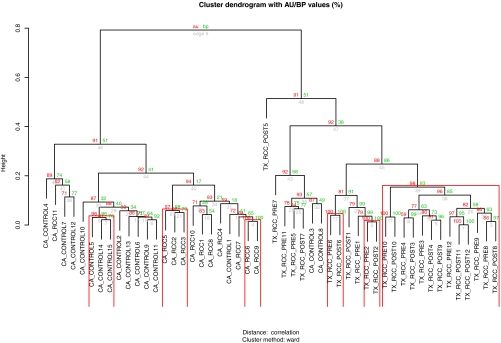
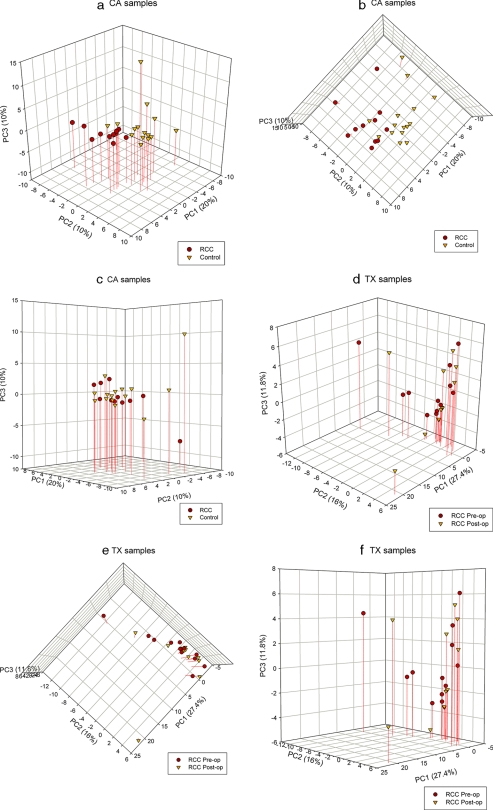
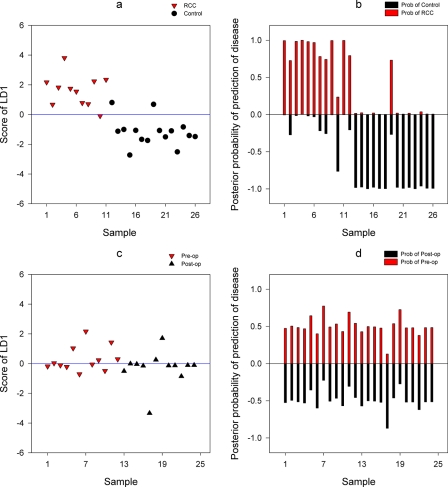
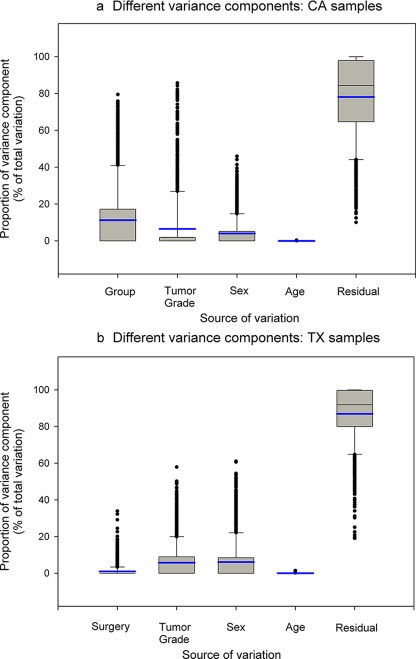
Renal cell carcinoma (RCC) accounts for 11,000 deaths per year in the United States. When detected early, generally serendipitously by imaging conducted for other reasons, long term survival is generally excellent. When detected with symptoms, prognosis is poor. Under these circumstances, a screening biomarker has the potential for substantial public health benefit. The purpose of this study was to evaluate the utility of urine metabolomics analysis for metabolomic profiling, identification of biomarkers, and ultimately for devising a urine screening test for RCC. Fifty urine samples were obtained from RCC and control patients from two institutions, and in a separate study, urine samples were taken from 13 normal individuals. Hydrophilic interaction chromatography-mass spectrometry was performed to identify small molecule metabolites present in each sample. Cluster analysis, principal components analysis, linear discriminant analysis, differential analysis, and variance component analysis were used to analyze the data. Previous work is extended to confirm the effectiveness of urine metabolomics analysis using a larger and more diverse patient cohort. It is now shown that the utility of this technique is dependent on the site of urine collection and that there exist substantial sources of variation of the urinary metabolomic profile, although group variation is sufficient to yield viable biomarkers. Surprisingly there is a small degree of variation in the urinary metabolomic profile in normal patients due to time since the last meal, and there is little difference in the urinary metabolomic profile in a cohort of pre- and postnephrectomy (partial or radical) renal cell carcinoma patients, suggesting that metabolic changes associated with RCC persist after removal of the primary tumor. After further investigations relating to the discovery and identity of individual biomarkers and attenuation of residual sources of variation, our work shows that urine metabolomics analysis has potential to lead to a diagnostic assay for RCC.


Figures

F<sc>ig</sc>. 1.
Fig. 1.
Comparison of distribution of metabolite levels within patients and between patients. Box plots represent the distribution of metabolite peak intensity measurements (on log2 scale) from intrapatient urine samples (in order of a.m. (fasting), p.m., and random) across all subjects. The box is drawn from the 25th to 75th percentiles in the distribution of intensities. The median, or 50th percentile, is drawn as a black horizontal line inside the box. The mean is represented by the blue horizontal line inside the box. The whiskers (lines extending from the box) describe the spread of the data within the 10th and 90th percentiles. The dots display any points beyond the 10th and 90th percentiles.
F<sc>ig</sc>. 2.
Fig. 2.
Comparisons of metabolomic spectra between varied times of day of urine collection. A first morning fasting sample (a.m.), a 30-min to 1-h postmeal sample (p.m.) on the same day, and a random sample taken irrespective of meals taken on a subsequent day (random) were obtained from normal subjects, and metabolites were analyzed by HILIC-MS. The standardized mean difference in intensity level for each of the metabolites (x axis) is shown on y axis. The red line represents the metabolites whose levels are significantly different between the two urine collection times.
F<sc>ig</sc>. 3.
Fig. 3.
Urine metabolomic profiles segregate by cancer status and collection site but not operative status. Values on the edges of the clustering are p values (%). Red values are AU p values, which are computed by multiscale bootstrap resampling, and green values are bootstrap probability values, which are computed by normal bootstrap resampling. Clusters with AU larger than 95% are highlighted by rectangles and are strongly supported by data. Urines are labeled as follows: the first term refers to site of collection; the second is RCC versus control; the third is pre- (PRE) or postoperative (POST) (where indicated); and the fourth is patient number.
F<sc>ig</sc>. 4.
Fig. 4.
Three-dimensional PC scores plots derived from the LC-HILIC spectra of urine samples show differences between cancer and control urine metabolomic profiles. PCA plots are derived from spectral data with percentage of variance captured by each PC for CA samples (a–c) and TX samples (d–f). op, operative.
F<sc>ig</sc>. 5.
Fig. 5.
Prediction of group membership using LDA for the choice of k = 4. LDA analysis was performed on all samples for CA samples (a and b) and TX samples (c and d). The posterior probabilities for the groups are shown on the y axis. The absolute posterior probability is the probability of assigning a sample to each group. op, operative.
F<sc>ig</sc>. 6.
Fig. 6.
Assessment of sources of variation in metabolomic profiles. Box plots of relative magnitudes of different sources of variation are shown for CA samples (a) and TX samples (b). The proportions of different variance components are shown on the y axis. The blue line represents the mean. The box is drawn from the 25th to 75th percentiles in the distribution of proportions of each variance component. The median, or 50th percentile, is drawn as a black horizontal line inside the box. The mean is represented by the blue horizontal line inside the box. The whiskers (lines extending from the box) describe the spread of the data within the 10th and 90th percentiles. The dots display any points beyond the 10th and 90th percentiles.

References

    1. Dettmer, K., and Hammock, B. D. ( 2004) Metabolomics—a new exciting field within the “omics” sciences. Environ. Health Perspect. 112, A396–A397 - PMC - PubMed
    1. Schmidt, C. ( 2004) Metabolomics takes its place as latest up-and-coming “omic” science. J. Natl. Cancer Inst. 96, 732–734 - PubMed
    1. Kind, T., Tolstikov, V., Fiehn, O., and Weiss, R. H. ( 2007) A comprehensive urinary metabolomic approach for identifying kidney cancer. Anal. Biochem. 363, 185–195 - PubMed
    1. Han, W. K., Waikar, S. S., Johnson, A., Betensky, R. A., Dent, C. L., Devarajan, P., and Bonventre, J. V. ( 2008) Urinary biomarkers in the early diagnosis of acute kidney injury. Kidney Int. 73, 863–869 - PMC - PubMed
    1. Waikar, S. S., and Bonventre, J. V. ( 2007) Biomarkers for the diagnosis of acute kidney injury. Curr. Opin. Nephrol. Hypertens. 16, 557–564 - PubMed

Publication types

Substances