Glucose and pharmacological modulators of ATP-sensitive K+ channels control [Ca2+]c by different mechanisms in isolated mouse alpha-cells
- PMID: 19008345
- PMCID: PMC2628615
- DOI: 10.2337/db07-1298
Glucose and pharmacological modulators of ATP-sensitive K+ channels control [Ca2+]c by different mechanisms in isolated mouse alpha-cells
Abstract
Objective: We studied how glucose and ATP-sensitive K(+) (K(ATP)) channel modulators affect alpha-cell [Ca(2+)](c).
Research design and methods: GYY mice (expressing enhanced yellow fluorescent protein in alpha-cells) and NMRI mice were used. [Ca(2+)](c), the K(ATP) current (I(KATP), perforated mode) and cell metabolism [NAD(P)H fluorescence] were monitored in single alpha-cells and, for comparison, in single beta-cells.
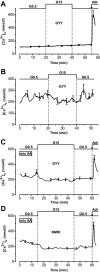
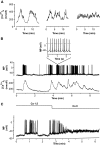
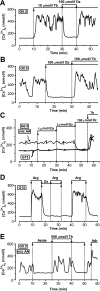
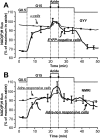
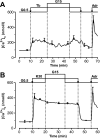
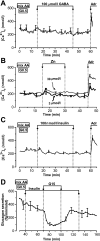
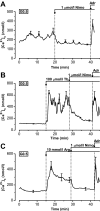
Results: In 0.5 mmol/l glucose, [Ca(2+)](c) oscillated in some alpha-cells and was basal in the others. Increasing glucose to 15 mmol/l decreased [Ca(2+)](c) by approximately 30% in oscillating cells and was ineffective in the others. alpha-Cell I(KATP) was inhibited by tolbutamide and activated by diazoxide or the mitochondrial poison azide, as in beta-cells. Tolbutamide increased alpha-cell [Ca(2+)](c), whereas diazoxide and azide abolished [Ca(2+)](c) oscillations. Increasing glucose from 0.5 to 15 mmol/l did not change I(KATP) and NAD(P)H fluorescence in alpha-cells in contrast to beta-cells. The use of nimodipine showed that L-type Ca(2+) channels are the main conduits for Ca(2+) influx in alpha-cells. gamma-Aminobutyric acid and zinc did not decrease alpha-cell [Ca(2+)](c), and insulin, although lowering [Ca(2+)](c) very modestly, did not affect glucagon secretion.
Conclusions: alpha-Cells display similarities with beta-cells: K(ATP) channels control Ca(2+) influx mainly through L-type Ca(2+) channels. However, alpha-cells have distinct features from beta-cells: Most K(ATP) channels are already closed at low glucose, glucose does not affect cell metabolism and I(KATP), and it slightly decreases [Ca(2+)](c). Hence, glucose and K(ATP) channel modulators exert distinct effects on alpha-cell [Ca(2+)](c). The direct small glucose-induced drop in alpha-cell [Ca(2+)](c) contributes likely only partly to the strong glucose-induced inhibition of glucagon secretion in islets.
Figures

Comment in
-
The alpha-cell conundrum: ATP-sensitive K+ channels and glucose sensing.Diabetes. 2009 Feb;58(2):304-6. doi: 10.2337/db08-1618. Diabetes. 2009. PMID: 19171747 Free PMC article. No abstract available.
Similar articles
-
KATP channel blockers control glucagon secretion by distinct mechanisms: A direct stimulation of α-cells involving a [Ca2+]c rise and an indirect inhibition mediated by somatostatin.Mol Metab. 2021 Nov;53:101268. doi: 10.1016/j.molmet.2021.101268. Epub 2021 Jun 9. Mol Metab. 2021. PMID: 34118477 Free PMC article.
-
Tolbutamide controls glucagon release from mouse islets differently than glucose: involvement of K(ATP) channels from both α-cells and δ-cells.Diabetes. 2013 May;62(5):1612-22. doi: 10.2337/db12-0347. Epub 2013 Feb 4. Diabetes. 2013. PMID: 23382449 Free PMC article.
-
Glucose inhibits glucagon secretion by decreasing [Ca2+]c and by reducing the efficacy of Ca2+ on exocytosis via somatostatin-dependent and independent mechanisms.Mol Metab. 2022 Jul;61:101495. doi: 10.1016/j.molmet.2022.101495. Epub 2022 Apr 11. Mol Metab. 2022. PMID: 35421610 Free PMC article.
-
ATP-regulated potassium channels and voltage-gated calcium channels in pancreatic alpha and beta cells: similar functions but reciprocal effects on secretion.Diabetologia. 2014 Sep;57(9):1749-61. doi: 10.1007/s00125-014-3279-8. Epub 2014 Jun 7. Diabetologia. 2014. PMID: 24906950 Review.
-
K(ATP)-channels and glucose-regulated glucagon secretion.Trends Endocrinol Metab. 2008 Oct;19(8):277-84. doi: 10.1016/j.tem.2008.07.003. Epub 2008 Sep 2. Trends Endocrinol Metab. 2008. PMID: 18771934 Review.
Cited by
-
Glucose decouples intracellular Ca2+ activity from glucagon secretion in mouse pancreatic islet alpha-cells.PLoS One. 2012;7(10):e47084. doi: 10.1371/journal.pone.0047084. Epub 2012 Oct 15. PLoS One. 2012. PMID: 23077547 Free PMC article.
-
In situ electrophysiological examination of pancreatic α cells in the streptozotocin-induced diabetes model, revealing the cellular basis of glucagon hypersecretion.Diabetes. 2013 Feb;62(2):519-30. doi: 10.2337/db11-0786. Epub 2012 Oct 5. Diabetes. 2013. PMID: 23043159 Free PMC article.
-
Lactate activation of α-cell KATP channels inhibits glucagon secretion by hyperpolarizing the membrane potential and reducing Ca2+ entry.Mol Metab. 2020 Dec;42:101056. doi: 10.1016/j.molmet.2020.101056. Epub 2020 Jul 28. Mol Metab. 2020. PMID: 32736089 Free PMC article.
-
Glucose suppression of glucagon secretion: metabolic and calcium responses from alpha-cells in intact mouse pancreatic islets.J Biol Chem. 2010 May 7;285(19):14389-98. doi: 10.1074/jbc.M109.069195. Epub 2010 Mar 15. J Biol Chem. 2010. PMID: 20231269 Free PMC article.
-
Calcium Oscillations in Pancreatic α-cells Rely on Noise and ATP-Driven Changes in Membrane Electrical Activity.Front Physiol. 2020 Nov 17;11:602844. doi: 10.3389/fphys.2020.602844. eCollection 2020. Front Physiol. 2020. PMID: 33281631 Free PMC article.
References
-
- Cryer PE: Hypoglycaemia: the limiting factor in the glycaemic management of type I and type II diabetes. Diabetologia 45: 937–948, 2002 - PubMed
-
- Dunning BE, Gerich JE: The role of α-cell dysregulation in fasting and postprandial hyperglycemia in type 2 diabetes and therapeutic implications. Endocr Rev 28: 253–283, 2007 - PubMed
-
- Ravier MA, Rutter GA: Glucose or insulin, but not zinc ions, inhibit glucagon secretion from mouse pancreatic α-cells. Diabetes 54: 1789–1797, 2005 - PubMed
-
- Xu E, Kumar M, Zhang Y, Ju W, Obata T, Zhang N, Liu S, Wendt A, Deng S, Ebina Y, Wheeler MB, Braun M, Wang Q: Intra-islet insulin suppresses glucagon release via GABA-GABAA receptor system. Cell Metab 3: 47–58, 2006 - PubMed
-
- Leung YM, Ahmed I, Sheu L, Gao X, Hara M, Tsushima RG, Diamant NE, Gaisano HY: Insulin regulates islet α-cell function by reducing KATP channel sensitivity to adenosine 5′-triphosphate inhibition. Endocrinology 147: 2155–2162, 2006 - PubMed
Publication types
MeSH terms
Substances
LinkOut - more resources
Full Text Sources
Miscellaneous

