

Chronic low-frequency rTMS of primary motor cortex diminishes exercise training-induced gains in maximal voluntary force in humans
- PMID: 19008488
- PMCID: PMC2644240
- DOI: 10.1152/japplphysiol.90701.2008
Chronic low-frequency rTMS of primary motor cortex diminishes exercise training-induced gains in maximal voluntary force in humans
Abstract
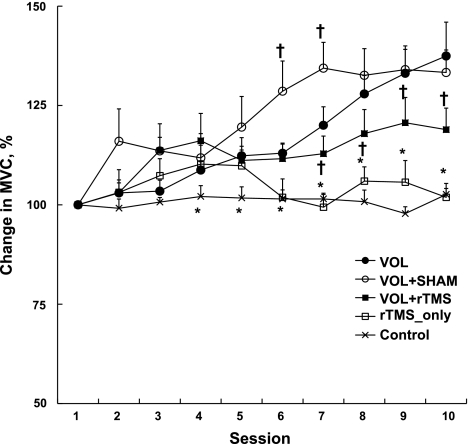
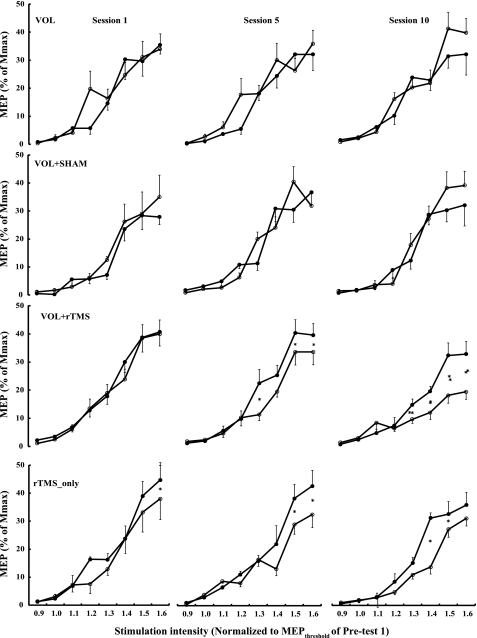
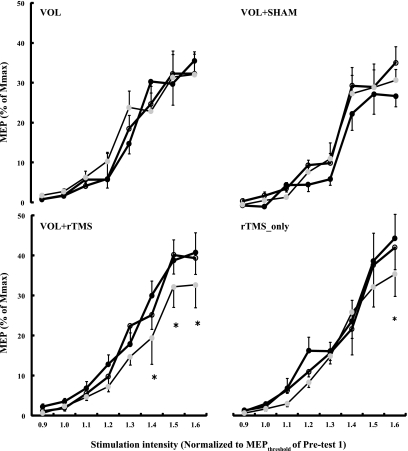
Although there is consensus that the central nervous system mediates the increases in maximal voluntary force (maximal voluntary contraction, MVC) produced by resistance exercise, the involvement of the primary motor cortex (M1) in these processes remains controversial. We hypothesized that 1-Hz repetitive transcranial magnetic stimulation (rTMS) of M1 during resistance training would diminish strength gains. Forty subjects were divided equally into five groups. Subjects voluntarily (Vol) abducted the first dorsal interosseus (FDI) (5 bouts x 10 repetitions, 10 sessions, 4 wk) at 70-80% MVC. Another group also exercised but in the 1-min-long interbout rest intervals they received rTMS [Vol+rTMS, 1 Hz, FDI motor area, 300 pulses/session, 120% of the resting motor threshold (rMT)]. The third group also exercised and received sham rTMS (Vol+Sham). The fourth group received only rTMS (rTMS_only). The 37.5% and 33.3% gains in MVC in Vol and Vol+Sham groups, respectively, were greater (P = 0.001) than the 18.9% gain in Vol+rTMS, 1.9% in rTMS_only, and 2.6% in unexercised control subjects who received no stimulation. Acutely, within sessions 5 and 10, single-pulse TMS revealed that motor-evoked potential size and recruitment curve slopes were reduced in Vol+rTMS and rTMS_only groups and accumulated to chronic reductions by session 10. There were no changes in rMT, maximum compound action potential amplitude (M(max)), and peripherally evoked twitch forces in the trained FDI and the untrained abductor digiti minimi. Although contributions from spinal sources cannot be excluded, the data suggest that M1 may play a role in mediating neural adaptations to strength training.
Figures
Similar articles
-
5 Hz Repetitive Transcranial Magnetic Stimulation with Maximum Voluntary Muscle Contraction Facilitates Cerebral Cortex Excitability of Normal Subjects.CNS Neurol Disord Drug Targets. 2015;14(10):1298-303. doi: 10.2174/1871527315666151111124216. CNS Neurol Disord Drug Targets. 2015. PMID: 26556078 Clinical Trial.
-
Long-lasting increase in corticospinal excitability after 1800 pulses of subthreshold 5 Hz repetitive TMS to the primary motor cortex.Clin Neurophysiol. 2004 Jul;115(7):1519-26. doi: 10.1016/j.clinph.2004.02.005. Clin Neurophysiol. 2004. PMID: 15203053 Clinical Trial.
-
Neuronavigation increases the physiologic and behavioral effects of low-frequency rTMS of primary motor cortex in healthy subjects.Brain Topogr. 2011 Mar;24(1):54-64. doi: 10.1007/s10548-010-0165-7. Epub 2010 Nov 13. Brain Topogr. 2011. PMID: 21076861 Free PMC article.
-
Neural adaptations to electrical stimulation strength training.Eur J Appl Physiol. 2011 Oct;111(10):2439-49. doi: 10.1007/s00421-011-2012-2. Epub 2011 Jun 4. Eur J Appl Physiol. 2011. PMID: 21643920 Free PMC article. Review.
-
Does ipsilateral corticospinal excitability play a decisive role in the cross-education effect caused by unilateral resistance training? A systematic review.Neurologia (Engl Ed). 2021 May;36(4):285-297. doi: 10.1016/j.nrl.2017.09.015. Epub 2018 Jan 2. Neurologia (Engl Ed). 2021. PMID: 29305060 English, Spanish.
Cited by
-
Determining the cortical, corticospinal, and reticulospinal responses to metronome-paced and self-paced strength training.Eur J Appl Physiol. 2025 Aug 31. doi: 10.1007/s00421-025-05939-3. Online ahead of print. Eur J Appl Physiol. 2025. PMID: 40886203
-
Tracking the corticospinal responses to strength training.Eur J Appl Physiol. 2020 Apr;120(4):783-798. doi: 10.1007/s00421-020-04316-6. Epub 2020 Feb 14. Eur J Appl Physiol. 2020. PMID: 32060740 Clinical Trial.
-
Effects of repetitive transcranial magnetic stimulation on recovery in lower limb muscle strength and gait function following spinal cord injury: a randomized controlled trial.Spinal Cord. 2022 Feb;60(2):135-141. doi: 10.1038/s41393-021-00703-8. Epub 2021 Sep 9. Spinal Cord. 2022. PMID: 34504284 Free PMC article. Clinical Trial.
-
Corticospinal and spinal adaptations to motor skill and resistance training: Potential mechanisms and implications for motor rehabilitation and athletic development.Eur J Appl Physiol. 2021 Mar;121(3):707-719. doi: 10.1007/s00421-020-04584-2. Epub 2021 Jan 2. Eur J Appl Physiol. 2021. PMID: 33389142 Review.
-
Intermittent Theta Burst Over M1 May Increase Peak Power of a Wingate Anaerobic Test and Prevent the Reduction of Voluntary Activation Measured with Transcranial Magnetic Stimulation.Front Behav Neurosci. 2016 Jul 19;10:150. doi: 10.3389/fnbeh.2016.00150. eCollection 2016. Front Behav Neurosci. 2016. PMID: 27486391 Free PMC article.
References
-
- Aagaard P, Simonsen EB, Andersen JL, Magnusson P, Dyhre-Poulsen P. Neural adaptation to resistance training: changes in evoked V-wave and H-reflex responses. J Appl Physiol 92: 2309–2318, 2002. - PubMed
-
- Asanuma H, Pavlides C. Neurobiological basis of motor learning in mammals. Neuroreport 8: i–vi, 1997. - PubMed
-
- Ashe J Force and the motor cortex. Behav Brain Res 87: 255–269, 1997. - PubMed
-
- Boerio D, Jubeau M, Zory R, Maffiuletti NA. Central and peripheral fatigue after electrostimulation-induced resistance exercise. Med Sci Sports Exerc 37: 973–978, 2005. - PubMed
-
- Buonomano DV, Merzenich MM. Cortical plasticity: from synapses to maps. Annu Rev Neurosci 21: 149–186, 1998. - PubMed
Publication types
MeSH terms
Grants and funding
LinkOut - more resources
Full Text Sources