

Vasoconstrictor responses in the upper and lower limbs to increases in transmural pressure
- PMID: 19008493
- PMCID: PMC4006614
- DOI: 10.1152/japplphysiol.90449.2008
Vasoconstrictor responses in the upper and lower limbs to increases in transmural pressure
Abstract
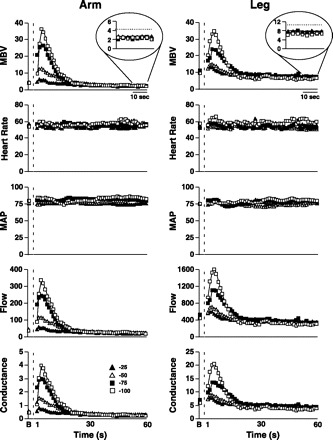
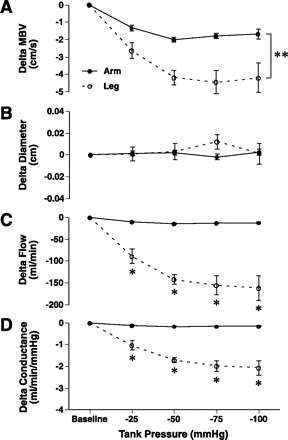
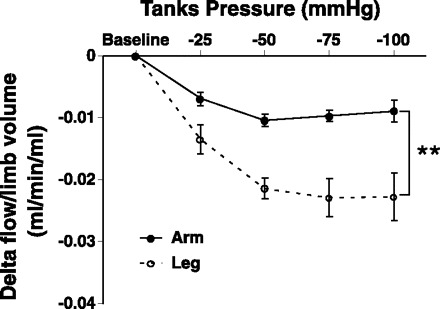
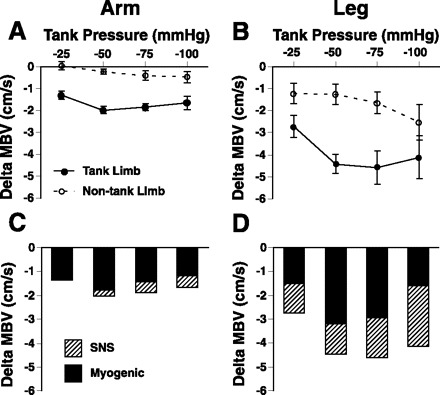
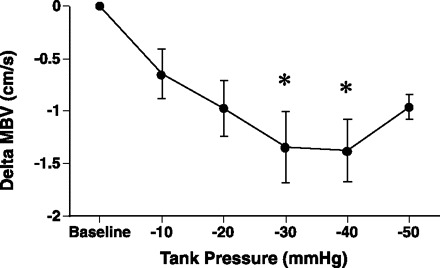
The purpose of this study was to examine upper and lower limb vasoconstrictor responses to changes in transmural pressure in humans. Brachial and femoral blood mean blood velocity (MBV) and vessel diameter (Doppler ultrasound) were measured in 20 supine healthy subjects (10 men and 10 women; 27 +/- 1 yr; mean +/- SE) during four levels of limb suction at -25, -50, -75, and -100 mmHg, respectively. Limb suction led to an initial rise in MBV followed by a rapid fall in flow velocity to a level below MBV baseline, indicating a vasoconstriction effect. Femoral compared with brachial vessels exhibited a greater fall in flow velocity at all levels of suction (-89 +/- 17 vs. -10 +/- 2, -142 +/- 11 vs. -14 +/- 2, -156 +/- 22 vs. -13 +/- 2, and -162 +/- 29 vs. -12 +/- 2 ml/min for -25, -50, -75, and -100 mmHg, respectively; interaction effect, P < 0.05). Even at low tank suction levels (i.e., -10 and -20 mmHg), significant brachial flow velocity vasoconstriction from baseline values was demonstrated, reflecting downstream resistance vessel changes (n = 14). Brachial and femoral diameters did not change during changes in negative tank pressure. During suction, changes in limb volumes were significantly greater in the forearm (1.4 +/- 0.5%, 2.4 +/- 0.8%, 3.5 +/- 1.0%, and 4.3 +/- 1.1%) compared with the calf (0.9 +/- 0.5%, 1.4 +/- 0.7%, 2.0 +/- 0.8%, and 2.8 +/- 1.1%) at all levels of negative tank pressures (-25, -50, -75, and -100 mmHg, respectively). Simultaneous measurements of both upper limbs and both lower limbs suggested that the majority of the reduction in flow was due to myogenic influences except when -100 mmHg of suction was applied to the lower limb. The greater vasoconstriction responses in the leg compared with the arm with suction appear to be influenced by both myogenic and sympathetic mechanisms.
Figures

Similar articles
-
Sex differences in limb vasoconstriction responses to increases in transmural pressures.Am J Physiol Heart Circ Physiol. 2009 Jan;296(1):H186-94. doi: 10.1152/ajpheart.00248.2008. Epub 2008 Nov 21. Am J Physiol Heart Circ Physiol. 2009. PMID: 19028800 Free PMC article.
-
Effects of age on brachial artery myogenic responses in humans.Am J Physiol Regul Integr Comp Physiol. 2004 Sep;287(3):R586-91. doi: 10.1152/ajpregu.00612.2003. Epub 2004 May 20. Am J Physiol Regul Integr Comp Physiol. 2004. PMID: 15155284
-
Effects of an oral glucose tolerance test on the myogenic response in healthy individuals.Am J Physiol Heart Circ Physiol. 2007 Jan;292(1):H304-10. doi: 10.1152/ajpheart.00940.2005. Epub 2006 Aug 25. Am J Physiol Heart Circ Physiol. 2007. PMID: 16935998 Clinical Trial.
-
Age- and limb-related differences in the vasoconstrictor response to limb dependency are not mediated by a sympathetic mechanism in humans.Acta Physiol (Oxf). 2012 Jul;205(3):372-80. doi: 10.1111/j.1748-1716.2012.02416.x. Epub 2012 Feb 18. Acta Physiol (Oxf). 2012. PMID: 22276905 Free PMC article. Clinical Trial.
-
Acrocyanosis: the Flying Dutchman.Vasc Med. 2011 Aug;16(4):288-301. doi: 10.1177/1358863X11398519. Epub 2011 Mar 22. Vasc Med. 2011. PMID: 21427140 Free PMC article. Review.
Cited by
-
Limb suction evoked during arterial occlusion causes systemic sympathetic activity in humans.Am J Physiol Regul Integr Comp Physiol. 2015 Sep;309(5):R482-8. doi: 10.1152/ajpregu.00117.2015. Epub 2015 Jul 1. Am J Physiol Regul Integr Comp Physiol. 2015. PMID: 26136530 Free PMC article.
-
External negative pressure transiently reduces intravenous pressure and augments the arteriovenous pressure gradient in the affected limb segment.PLoS One. 2024 Dec 5;19(12):e0315231. doi: 10.1371/journal.pone.0315231. eCollection 2024. PLoS One. 2024. PMID: 39637184 Free PMC article.
-
Increasing blood flow to exercising muscle attenuates systemic cardiovascular responses during dynamic exercise in humans.Am J Physiol Regul Integr Comp Physiol. 2015 Nov 15;309(10):R1234-42. doi: 10.1152/ajpregu.00063.2015. Epub 2015 Sep 16. Am J Physiol Regul Integr Comp Physiol. 2015. PMID: 26377556 Free PMC article.
-
Effect of vacuum sealing drainage in osteofascial compartment syndrome.Int J Clin Exp Med. 2015 Sep 15;8(9):16112-6. eCollection 2015. Int J Clin Exp Med. 2015. PMID: 26629121 Free PMC article.
-
Peripheral vasoconstriction is not elevated during hyperreactive responses to the cold pressor test: a cross-sectional study.Front Physiol. 2025 Mar 12;16:1532992. doi: 10.3389/fphys.2025.1532992. eCollection 2025. Front Physiol. 2025. PMID: 40144544 Free PMC article.
References
-
- Andersen EB, Boesen F, Henriksen O, Sonne M. Blood flow in skeletal muscle of tetraplegic man during postural changes. Clin Sci (Lond) 70: 321–325, 1986 - PubMed
-
- Brede M, Wiesmann F, Jahns R, Hadamek K, Arnolt C, Neubauer S, Lohse MJ, Hein L. Feedback inhibition of catecholamine release by two different alpha2-adrenoceptor subtypes prevents progression of heart failure. Circulation 106: 2491–2496, 2002 - PubMed
-
- Corretti MC, Anderson TJ, Benjamin EJ, Celermajer D, Charbonneau F, Creager MA, Deanfield J, Drexler H, Gerhard-Herman M, Herrington D, Vallance P, Vita J, Vogel R. Guidelines for the ultrasound assessment of endothelial-dependent flow-mediated vasodilation of the brachial artery: a report of the International Brachial Artery Reactivity Task Force. J Am Coll Cardiol 39: 257–265, 2002 - PubMed
Publication types
MeSH terms
Grants and funding
LinkOut - more resources
Full Text Sources