

Polar or apolar--the role of polarity for urea-induced protein denaturation
- PMID: 19008937
- PMCID: PMC2570617
- DOI: 10.1371/journal.pcbi.1000221
Polar or apolar--the role of polarity for urea-induced protein denaturation
Abstract
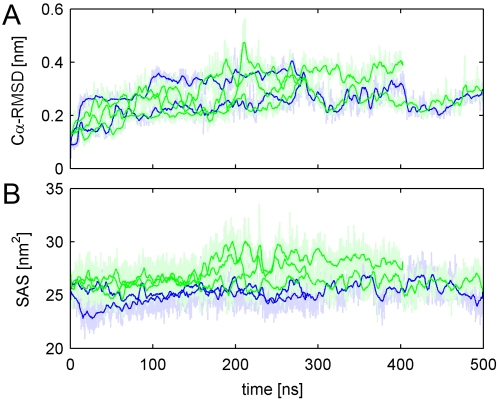
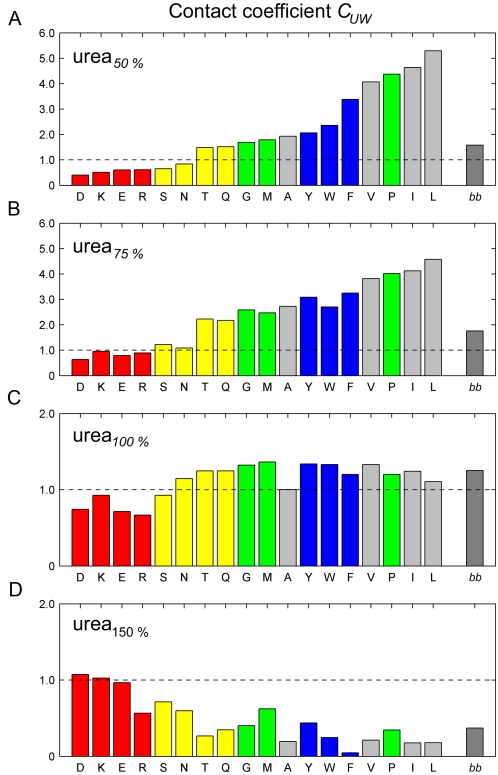
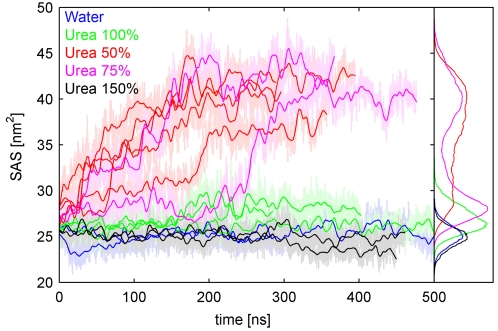
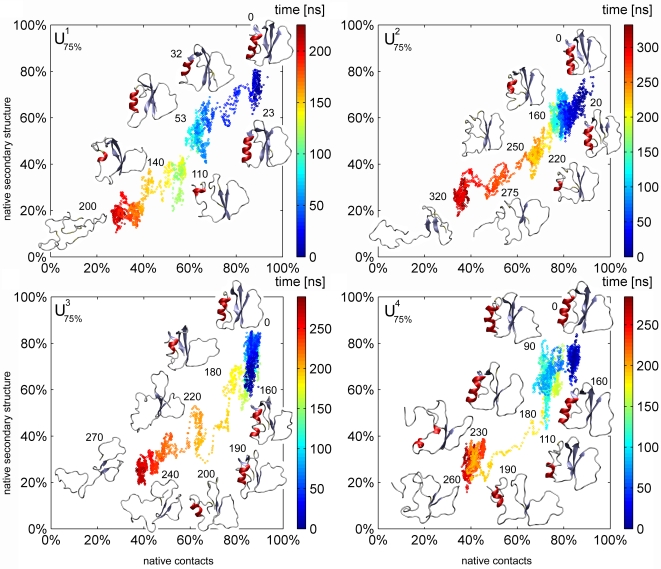
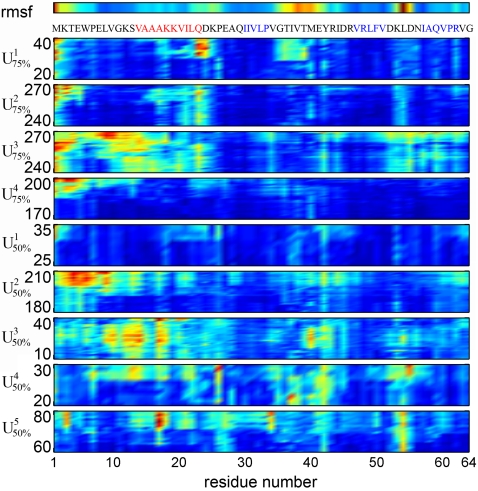
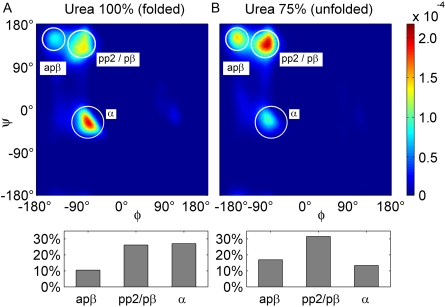
Urea-induced protein denaturation is widely used to study protein folding and stability; however, the molecular mechanism and driving forces of this process are not yet fully understood. In particular, it is unclear whether either hydrophobic or polar interactions between urea molecules and residues at the protein surface drive denaturation. To address this question, here, many molecular dynamics simulations totalling ca. 7 micros of the CI2 protein in aqueous solution served to perform a computational thought experiment, in which we varied the polarity of urea. For apolar driving forces, hypopolar urea should show increased denaturation power; for polar driving forces, hyperpolar urea should be the stronger denaturant. Indeed, protein unfolding was observed in all simulations with decreased urea polarity. Hyperpolar urea, in contrast, turned out to stabilize the native state. Moreover, the differential interaction preferences between urea and the 20 amino acids turned out to be enhanced for hypopolar urea and suppressed (or even inverted) for hyperpolar urea. These results strongly suggest that apolar urea-protein interactions, and not polar interactions, are the dominant driving force for denaturation. Further, the observed interactions provide a detailed picture of the underlying molecular driving forces. Our simulations finally allowed characterization of CI2 unfolding pathways. Unfolding proceeds sequentially with alternating loss of secondary or tertiary structure. After the transition state, unfolding pathways show large structural heterogeneity.
Conflict of interest statement
The authors have declared that no competing interests exist.
Figures
References
-
- Rupley JA. The effect of urea and amides upon water structure. J Phys Chem. 1964;68:2002–2003.
-
- Frank HS, Franks F. Structural approach to the solvent power of water for hydrocarbons; urea as a structure breaker. J Chem Phys. 1968;48:4746–4757.
-
- Vanzi F, Madan B, Sharp K. Effect of the protein denaturants urea and guanidinium on water structure: a structural and thermodynamic study. J Am Chem Soc. 1998;120:10748–10753.
-
- Nozaki Y, Tanford C. Solubility of amino acids and related compounds in aqueous urea solutions. J Biol Chem. 1963;238:4074–4081. - PubMed
-
- Robinson DR, Jencks WP. The effect of compounds of the urea-guanidinium class on the activity coefficient of acetyltetraglycine ethyl ester and related compound. J Am Chem Soc. 1965;87:2462–2470. - PubMed
Publication types
MeSH terms
Substances
LinkOut - more resources
Full Text Sources
