. 2008 Nov;4(11):e1000224.
doi: 10.1371/journal.pcbi.1000224. Epub 2008 Nov 14.

A predictive model of the oxygen and heme regulatory network in yeast

Affiliations

A predictive model of the oxygen and heme regulatory network in yeast

Anshul Kundaje et al. PLoS Comput Biol. 2008 Nov.

Abstract

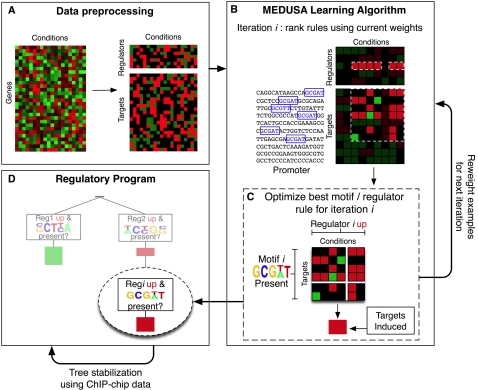
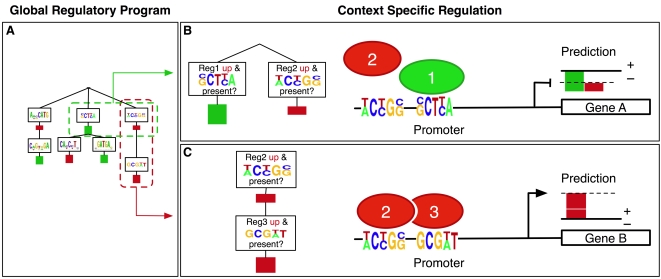
Deciphering gene regulatory mechanisms through the analysis of high-throughput expression data is a challenging computational problem. Previous computational studies have used large expression datasets in order to resolve fine patterns of coexpression, producing clusters or modules of potentially coregulated genes. These methods typically examine promoter sequence information, such as DNA motifs or transcription factor occupancy data, in a separate step after clustering. We needed an alternative and more integrative approach to study the oxygen regulatory network in Saccharomyces cerevisiae using a small dataset of perturbation experiments. Mechanisms of oxygen sensing and regulation underlie many physiological and pathological processes, and only a handful of oxygen regulators have been identified in previous studies. We used a new machine learning algorithm called MEDUSA to uncover detailed information about the oxygen regulatory network using genome-wide expression changes in response to perturbations in the levels of oxygen, heme, Hap1, and Co2+. MEDUSA integrates mRNA expression, promoter sequence, and ChIP-chip occupancy data to learn a model that accurately predicts the differential expression of target genes in held-out data. We used a novel margin-based score to extract significant condition-specific regulators and assemble a global map of the oxygen sensing and regulatory network. This network includes both known oxygen and heme regulators, such as Hap1, Mga2, Hap4, and Upc2, as well as many new candidate regulators. MEDUSA also identified many DNA motifs that are consistent with previous experimentally identified transcription factor binding sites. Because MEDUSA's regulatory program associates regulators to target genes through their promoter sequences, we directly tested the predicted regulators for OLE1, a gene specifically induced under hypoxia, by experimental analysis of the activity of its promoter. In each case, deletion of the candidate regulator resulted in the predicted effect on promoter activity, confirming that several novel regulators identified by MEDUSA are indeed involved in oxygen regulation. MEDUSA can reveal important information from a small dataset and generate testable hypotheses for further experimental analysis. Supplemental data are included.


Conflict of interest statement

The authors have declared that no competing interests exist.

Figures

Figure 1
Figure 1. Expression signatures identified by perturbation of the oxygen regulatory network.
(A) Heat maps showing real-valued expression profiles of genes that are members of the 16 signatures identified. The expression values are in log2. The rows represent genes and the columns represent the 6 experimental conditions. Bright red indicates strong upregulation, bright green indicates strong downregulation, and black indicates no change in expression. Each signature is labeled with statistically significant functional annotations. (B) Each block displays the average real-valued expression (stem plot in dark blue) and discrete expression profile (bar plot in light blue) for each signature over the 6 experimental conditions. The real-valued expression values are in log2.
Figure 2
Figure 2. A schematic flow chart showing the algorithmic steps for learning the oxygen regulatory program with MEDUSA.
(A) The mRNA expression data is discretized into three states, up (over-expressed), down (under-expressed), and baseline (not significantly differentially expressed), and genes are partitioned into potential regulators (transcription factors and signal transducers) and targets. The regulators are also included in the list of target genes so that their transcriptional regulation can be modeled. (B) The MEDUSA learning algorithm is presented with the promoter sequences of target genes, the discretized expression profiles of the regulators across multiple conditions, and the differentially expressed (up and down) target gene examples from these experiments. Baseline examples are not used to train MEDUSA. In the first stage of training, MEDUSA considers rules based on promoter sequence data and regulator expression states. MEDUSA uses a boosting strategy to avoid overfitting over many rounds of the algorithm. At each iteration i, a motif/regulator rule is chosen based on the current weights on the training examples; this rule predict that targets whose promoters contain the motif will go up (or down) in experiments where the regulator is over- (or under-) expressed. Before the next iteration, the examples are reweighted to emphasize the ones that are difficult to predict. (C) To learn the sequence motif, the algorithm agglomerates predictive k-mer sequences to produce candidate PSSMs, and it optimizes both the choice of PSSM and the probabilistic threshold used to determine where the hits of the motif occur. (D) At the end of each round of training, motif /regulator rules are placed into an alternating decision tree, building a global regulatory program. This regulatory program can be used to predict target gene up/down regulation for gene-experiment examples that were not seen in training. In order to produce a more stable decision tree, we perform a second pass of the tree-learning algorithm using a stabilized variant of boosting that gives more consistent models over different subsets of the training data. At this stage, both the motifs learned previously by MEDUSA and TF occupancies from ChIP-chip experiments are used as sequence features for the final regulatory program.
Figure 3
Figure 3. Simplified example showing how the regulatory program learned by MEDUSA predicts context-specific up/down gene expression.
MEDUSA learns a global regulatory program described by an alternating decision tree. A simple regulatory program is shown in part A of the figure, along with the prediction it makes in two contexts, indicated as context B (top right) and context C (bottom right). The interaction between a regulator and a motif and the effect on targets is described by a decision node, which contains a logical condition to be tested, e.g., “Is regulator i up in the experiment and is motif i present in the promoter?”, and by the contribution that this motif/regulator pair makes to the up/down prediction of target gene expression if the logical condition is true, which is indicated by a colored bar. Contributions to upregulation of targets are shown in red and downregulation of targets in green. Combinatorial regulation is encoded by the tree structure: we obtain a prediction score for the up/down regulation of a target gene in a given experimental condition by starting at the root and recursively working downwards in the tree, seeing which prediction nodes are reachable by answering “yes” to logical conditions and summing all score contributions for the nodes visited. (Context B) In the first context, both Reg 2, a transcriptional activator, and Reg 1, a repressor, are expressed, and the promoter of gene A contains the motifs associated by the regulatory program to both these regulators. The regulatory program computes the prediction score by summing the larger contribution of the repressor (green bar) with the smaller contribution of the activator (red bar) to obtain a negative prediction score (indicated by the dashed line on the far right), i.e., gene A is predicted to be downregulated. (Context C) In the second context, both the activator Reg 2 and a co-factor, Reg 3, are expressed and can bind to the promoter of gene B based on the presence of the associated motifs in the regulatory program. The logic of the tree requires that the condition involving Reg 2 must hold before the contribution of the node containing Reg 3, at the next level of the tree, can be counted. Here, both conditions hold, and the regulatory program adds two positive contributions to obtain a confident prediction that gene B will be upregulated.
Figure 4
Figure 4. Heat maps showing predictive regulators, predictive motifs, and targets induced by oxygen and heme.
(A) A Venn diagram illustrating the regulators involved in controlling hypoxically suppressed (oxygen-induced) genes in HAP1 and Δhap1 cells, and heme-induced genes. For each experiment, the statistically significant regulators associated with the set of downregulated target genes are determined by use of a margin-based score (see Methods). (B) Patterns of up (red), down (green), and baseline (black) expression levels for the statistically significant regulators controlling downregulated target genes across the three experimental conditions. (C) The top-ranked sequence features learned by MEDUSA, as determined by a margin-based score, and their hits across the set of target gene promoters. The PSSMs learned by MEDUSA are represented by their consensus patterns. ChIP-chip occupancy features also occur in the list of most significant features. For example, SIG1-CH refers to ChIP-chip occupancy by the transcription factor SIG1 and appears as a highly-ranked promoter sequence feature. The presence or absence of a sequence feature in a gene's promoter is represented by blue or black blocks respectively. (D) Discretized gene expression levels for the full set of target genes represented in the Venn diagram (total of 1798 genes), given by combining the down-regulated target gene list from each of the three experimental conditions. Note that the expression patterns include only down and baseline expression levels across all three conditions.
Figure 5
Figure 5. Venn diagrams showing the statistically significant, high ranking regulators mediating the regulation of oxygen-regulated, heme-regulated, and Co2+-inducible genes in HAP1 and Δhap1 cells.
(A) A Venn diagram illustrating the regulators involved in controlling hypoxically induced (oxygen-suppressed) genes in HAP1 and Δhap1 cells, and heme-suppressed genes. (B) A Venn diagram illustrating the regulators involved in controlling hypoxically induced (oxygen-suppressed) genes in HAP1 and Δhap1 cells, and Co2+-inducible genes. (C) A Venn diagram illustrating the regulators involved in controlling hypoxically induced (oxygen-suppressed) genes in HAP1 cells at 1.5 or 6 hours after shifting to anaerobic growth conditions. (D) A Venn diagram illustrating the regulators involved in controlling hypoxically suppressed (oxygen-induced) genes in HAP1 cells at 1.5 or 6 hours after shifting to anaerobic growth conditions.
Figure 6
Figure 6. A global read-out of the oxygen regulatory network learned by MEDUSA.
By applying margin-based scoring to the full list of potential regulators for the up- and downregulated target genes in each experimental condition, we identified 54 predictive regulators in the oxygen regulatory network. For each condition, we show the state of the regulator in red (upregulated) or green (downregulated), where the brightness of the color indicates the significance of its contribution to up or down predictions for the targets, based on normalized margin score. Significance of the regulators to the up-regulated targets is shown in the left half of the column, while contribution to the down-regulated targets is shown in the right half. Some regulators contribute significantly to the prediction of both up- and down-regulated targets within a condition due to indirect regulation (e.g., a transcriptional activator that controls a repressor), combinatorial effects, and promoter sequence information. Regulators are ranked from top to bottom in order of overall predictive significance across experiments, computed by taking the larger of the normalized margin scores for up and down targets in each experiment and then averaging across experiments. The functional category for each regulator is indicated by an annotation given at the right of the figure and explained in the legend.
Figure 7
Figure 7. Experimental confirmation of the oxygen regulators identified by MEDUSA.
MEDUSA identified Mdg1, Met28, Upc2, Pig1 and Rme1 as specific regulators of the hypoxia-inducible OLE1 gene. To detect the effects of these regulators on the OLE1 gene, the full-length OLE1 promoter-lacZ reporter was transformed into the wild type or mutant cells with one of the indicated genes deleted. β-galactosidase activities were measured in cells grown in air or in hypoxic chamber. Data plotted here are averages from at least three independent transformants. The arrows indicate the effects of hypoxia on the expression levels of Mdg1, Met28, Upc2, Pig1 and Rme1. That is, Mdg1 was downregulated whereas the rest were upregulated in hypoxic cells.
Figure 8
Figure 8. Comparison of significance and abundance of motifs learned by MEDUSA and AlignACE for the 16 expression signatures identified in the dataset.
Each row in the table represents a motif found by MEDUSA only (top section), by both MEDUSA and AlignACE (middle section), or by AlignACE only (bottom section). The first column describes the motif by the name of the corresponding transcription factor followed by the consensus motif sequence. Some transcription factor names are followed by ‘ChIP’, indicating that these are significant ChIP-chip occupancy features identified by MEDUSA. Motif descriptions highlighted in red indicate transcription factors that are specifically known to have an important function in hypoxia. The remainder of the table shows MEDUSA (left section) and AlignACE (right section) results for each signature (S1 to S16), represented by a pair of columns scoring motifs by statistical significance (left column in each pair) and abundance within the set of genes making up the signature (right column in each pair). For statistical significance scores, columns labeled ‘S’ represent the margin scores (in shades of blue) assigned by MEDUSA, and columns labeled ‘M’ represent the maximum a posteriori (MAP) scores (in shades of green) assigned by AlignACE. In both cases, dark shades indicate higher statistical significance. The columns labeled ‘A’ show the percentage abundance scores of the motifs in each of the signatures. For AlignACE, the abundance score of a motif simply reflects the ratio of the number of genes in each cluster whose promoters contain the motif, to the cluster size. For MEDUSA, it refers to the ratio of the number of genes in each cluster for which the motif contributes positively to the margin score, to the size of the cluster. A motif could be present in the promoter of a gene but not identified as significant by MEDUSA. In such cases, the motif does not contribute to the MEDUSA abundance score. Dark shades of pink indicate strong abundance scores.
Figure 9
Figure 9. Pseudocode for the MEDUSA learning algorithm.
The figure gives detailed pseudocode for the core MEDUSA algorithm which learns DNA motifs de novo from promoter sequences and assembles motifs and regulators into an alternating decision tree (ADT) for predicting up/down regulation of target genes.

Similar articles

Cited by

References

    1. Bunn HF, Poyton RO. Oxygen sensing and molecular adaptation to hypoxia. Physiol Rev. 1996;76:839–885. - PubMed
    1. Kwast KE, Lai LC, Menda N, James DT, III, Aref S, et al. Genomic analyses of anaerobically induced genes in Saccharomyces cerevisiae: functional roles of Rox1 and other factors in mediating the anoxic response. J Bacteriol. 2002;184:250–265. - PMC - PubMed
    1. Tai SL, Boer VM, Daran-Lapujade P, Walsh MC, de Winde JH, et al. Two-dimensional transcriptome analysis in chemostat cultures. Combinatorial effects of oxygen availability and macronutrient limitation in Saccharomyces cerevisiae. J Biol Chem. 2005;280:437–447. - PubMed
    1. Piper MD, Daran-Lapujade P, Bro C, Regenberg B, Knudsen S, et al. Reproducibility of oligonucleotide microarray transcriptome analyses. An interlaboratory comparison using chemostat cultures of Saccharomyces cerevisiae. J Biol Chem. 2002;277:37001–37008. - PubMed
    1. ter Linde JJ, Liang H, Davis RW, Steensma HY, van Dijken JP, et al. Genome-wide transcriptional analysis of aerobic and anaerobic chemostat cultures of Saccharomyces cerevisiae. J Bacteriol. 1999;181:7409–7413. - PMC - PubMed

Publication types