. 2008 Nov;4(11):e1000207.
doi: 10.1371/journal.ppat.1000207. Epub 2008 Nov 14.

The host cell sulfonation pathway contributes to retroviral infection at a step coincident with provirus establishment

Affiliations

The host cell sulfonation pathway contributes to retroviral infection at a step coincident with provirus establishment

James W Bruce et al. PLoS Pathog. 2008 Nov.

Abstract

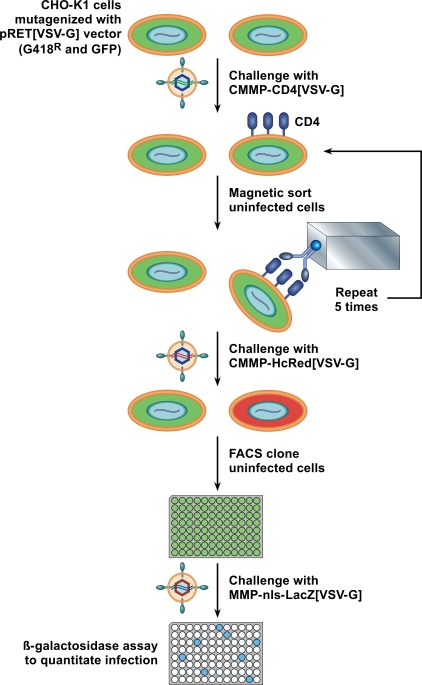
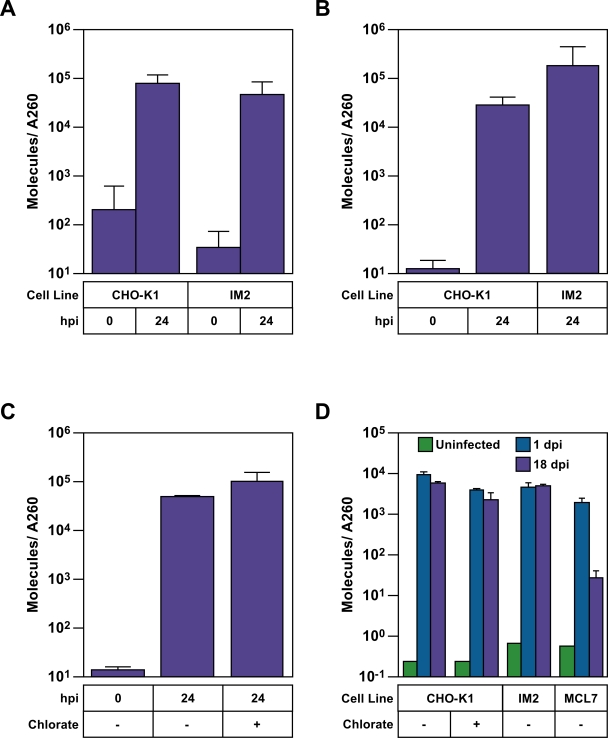
The early steps of retrovirus replication leading up to provirus establishment are highly dependent on cellular processes and represent a time when the virus is particularly vulnerable to antivirals and host defense mechanisms. However, the roles played by cellular factors are only partially understood. To identify cellular processes that participate in these critical steps, we employed a high volume screening of insertionally mutagenized somatic cells using a murine leukemia virus (MLV) vector. This approach identified a role for 3'-phosphoadenosine 5'-phosphosulfate synthase 1 (PAPSS1), one of two enzymes that synthesize PAPS, the high energy sulfate donor used in all sulfonation reactions catalyzed by cellular sulfotransferases. The role of the cellular sulfonation pathway was confirmed using chemical inhibitors of PAPS synthases and cellular sulfotransferases. The requirement for sulfonation was mapped to a stage during or shortly after MLV provirus establishment and influenced subsequent gene expression from the viral long terminal repeat (LTR) promoter. Infection of cells by an HIV vector was also shown to be highly dependent on the cellular sulfonation pathway. These studies have uncovered a heretofore unknown regulatory step of retroviral replication, have defined a new biological function for sulfonation in nuclear gene expression, and provide a potentially valuable new target for HIV/AIDS therapy.


Conflict of interest statement

The authors have declared that no competing interests exist.

Figures

Figure 1
Figure 1. Scheme used to isolate pRET-mutagenized CHO-K1 cell lines that are resistant to subsequent retroviral infection.
CHO-K1 cells were mutagenized by infection with a VSV-G pseudotyped pRET vector at a moi of 0.01 G418R transducing units and selected in G418 for 2 weeks. Pools of mutagenized cells (1×10⁷) were challenged with a VSV-G pseudotyped MLV vector that encodes CD4. Infected cells were depleted from the population by magnetic sorting with an iron conjugated anti-CD4 antibody. After five rounds of challenge and sorting, the enriched pools were infected with a VSV-G pseudotyped MLV vector that encodes the red fluorescent protein HcRed. The non-fluorescent cells were single cell cloned by FACS, expanded and seeded into duplicate assay plates. The assay plates were infected with another VSV-G pseudotyped MLV vector that encodes β-galactosidase. One plate was then assayed with a chemiluminescent assay for β-galactosidase. For control purposes, the other plate was assayed with a luciferase based chemiluminescent assay to measure viable cell number.
Figure 2
Figure 2. Resistance of the IM2 cell line maps to the MLV core.
(A) CHO-K1and IM2 cells were challenged with serial dilutions of the VSV-G pseudotyped MLV vector (MMP-nls-lacZ[VSV-G]), encoding β-galactosidase. The cells were then stained 48 hpi with X-gal, the number of blue cells were counted, and the data reported as the percentage of LacZ transducing units (LTU) obtained from WT CHO-K1 infections (5×10⁵ LTU). The data shown are the average of three experiments each performed with triplicate samples. Error bars indicate the standard deviation of the data. (B) CHO-K1 cells and IM2 cells, engineered to express TVA800, or wild-type CHO-K1 cells, were challenged with either pMMp-nls-LacZ[envA], an EnvA pseudotyped MLV vector encoding β-galactosidase, or with RCASBP(A)-AP, an ALSV-A vector encoding heat stable alkaline phosphatase. Infection was monitored using chemiluminescent assays to detect reporter enzyme activities along with a chemiluminescent assay to measure relative viable cell numbers. The ratios of [enzyme activities∶relative viable cell number] were calculated for each sample and compared with values from CHO-K1 TVA 800 cells (defined as 100% infection). The data shown are the average mean values obtained in an experiment performed with quadruplicate samples and are representative of three independent experiments. Error bars indicate the standard deviation of the data.
Figure 3
Figure 3. PAPS synthase 1 gene is disrupted in IM2 cells.
(A) The pRET mutagenic vector is integrated upstream of exon 12 of the PAPSS1 gene. The nucleotide sequence of the fusion junction that is formed via mRNA splicing involving the splice donor located downstream of the NPT gene in pRET, and the splice acceptor located upstream of exon 12 of the hamster PAPSS1 gene is shown. Since the hamster PAPSS1 gene has not been previously characterized by DNA sequencing, this sequence at the fusion junction is shown aligned with that of the corresponding mouse PAPSS1 exon 11-exon 12 junction nucleotide sequence. The amino acid sequence encoded by this region of mouse PAPSS1 is also shown. The nucleotide differences between the hamster and mouse sequences occur at codon wobble positions (indicated with lowercase letters) that do not alter the amino acid sequence. (B) IM2 cells were engineered to express human PAPSS1 or PAPSS2, or a control cDNA, as described under Materials and Methods. Lysates prepared from these cells were assayed for PAPSS activity by adding ATP and [35]S labeled sulfate, and the samples were then subjected to thin layer chromatography to separate the substrate from the reaction products (APS and PAPS). The experiment shown is representative of three independent experiments. (C) The amounts of PAPS synthesized in the samples shown in panel C were quantitated as described under Materials and Methods and are shown relative to the amount produced by the wild-type CHO-K1 cell extract (defined as 100%). The data shown are the average of three independent experiments. Error bars indicate the standard deviation of the data.
Figure 4
Figure 4. PAPSS activity is required for efficient MLV infection.
(A) CHO-K1and IM2 cells engeneered to express either a control cDNA, human PAPSS1 or human PAPSS2 were challenged with serial dilutions of the VSV-G pseudotyped MLV vector (MMP-nls-lacZ[VSV-G]), encoding β-galactosidase. The cells were then stained 48 hpi with X-gal, the number of blue cells were counted, and the data reported as the percentage of LacZ transducing units (LTU) obtained from WT CHO-K1 infections (5×10⁵ LTU). The data shown are the average mean values obtained with triplicate samples. (B and C) CHO-K1 cells were challenged with a VSV-G pseudotyped MLV vector MMP-nls-lacZ[VSV-G]) in the presence of either 100 mM chlorate, 5 mM Guaiacol, or both 100 mM chlorate and 5 mM Guaiacol. The cells were subsequently assayed for either β-galactosidase activity using a chemiluminescent assay (B), or for viable cell number using a chemiluminescent assay (C). The data in panels B and C are the average mean values obtained in an experiment performed with quadruplicate samples and are reported as a percentage of that seen with untreated cells. (D) Chicken DF-1 cells were challenged with either the MLV vector pMMp-nls-LacZ[VSV-G], or the ASLV-A vector RCASBP(A)-AP in the presence of 100 mM chlorate and assayed 48 hpi with chemiluminescent assays for reporter enzyme activities or viable cell number. The ratios of [enzyme activities∶relative viable cell number] were calculated for each sample and compared with untreated controls (defined as 100% infection). The data shown are the average mean values obtained in an experiment performed with quadruplicate samples. The results shown in panels A–D are representative of three independent experiments and error bars indicate the standard deviation of the data.
Figure 5
Figure 5. The sulfonation pathway does not influence reverse transcription or the level of integrated virus DNA.
(A and B) CHO-K1 cell lines were challenged with the VSV-G pseudotyped MLV vector LEGFP. Total DNA (A) or DNA from isolated nuclei (B) were harvested at 0 or 24 hpi, DNA concentration was quantitated by A260, and a real-time PCR amplification analysis was performed to measure the levels of viral DNA that were synthesized. (C) Untreated CHO-K1 cells or CHO-K1 cells that had been pretreated for 16 hrs with 100 mM chlorate and maintained in medium containing this concentration of chlorate were challenged with the MLV vector and subsequently analyzed for reverse transcription products as described in panel A. (D) CHO-K1 cells that were either untreated or treated with 100 mM chlorate, IM2 cells, and MCL7 cells, were challenged with the same VSV-G pseudotyped MLV vector and total DNA was harvested at 1 or 18 days post infection for real time PCR quantitation of viral DNA products. The chemically-mutagenized MCL7 cell line displays a strong block to MLV DNA integration . Chlorate treated CHO-K1 cells were passaged in medium containing 100 mM chlorate for the duration of the experiment. The data shown in panels A–D are the average mean values obtained in independent experiments performed with triplicate samples and each is representative of three independent experiments. Error bars indicate the standard deviation of the data.
Figure 6
Figure 6. The sulfonation pathway influences transcription specifically from the MLV LTR.
(A) CHO-K1 or IM2 cells were challenged with the VSV-G pseudotyped MLV vectors MMP-nls-lacZ, which directs MLV LTR-driven lacZ gene expression, or with pQCLIN, a self-inactivating MLV vector with defective LTRs and an internal CMV promoter which drives lacZ expression. The cells were subsequently assayed for β-galactosidase activity and viable cell number and the data reported as in Fig. 2B with the ratio of [β-galactosidase activity: relative viable cell number] observed with CHO-K1 cells defined as 100% infection. (B) CHO-K1cells were challenged with the same virus vectors used in panel A but in the presence of 100 mM chlorate and 5 mM Guaiacol. The cells were subsequently assayed for β-galactosidase activity as in panel A. The data shown in panels A and B are the average mean values obtained in an experiment performed with quadruplicate samples and each is representative of three independent experiments. (C) Total RNA was isolated from CHO-K1 or IM2 cells that had been infected with the VSV-G pseudotyped MLV vector pCMMP- EGFP. RNase protection assays were performed using a probe that recognizes either the provirus-derived transcript or the hamster β-actin gene. Protected fragments were separated, subjected to gel electrophoresis as described under Materials and Methods, and exposed to a phosphoimager plate. (D) CHO-K1 cells were challenged with virus as in panel C in the presence of either 100 mM chlorate, 5 mM guaiacol, or with both inhibitors. The inhibitors were present throughout the infection. (E) The mean average data of at least three independent RNase protection experiments, conducted as in panels C and D, were quantitated by phosphorimaging using the image quant software volume method. The relative levels of viral transcripts were normalized to the corresponding β-actin levels and are reported as a percentage of those seen with untreated CHO-K1 cells (defined as 100%). Error bars in panels A, B and E, indicate the standard deviation of the data.
Figure 7
Figure 7. Chlorate treatment during virus infection reduces reporter gene expression from newly acquired, but not resident proviruses.
(A) CHO-K1 cells (1×10⁵) were challenged with 5×10⁵ IU of MMP-nls-lacZ[VSV-G] at 4°C for 2 hrs and then warmed to 37°C to initiate infection at t = 0 mins. Chlorate was added to 100 mM final concentration at the indicated hours post infection (hpi). At 48 hpi, the cells were assayed for β-galactosidase activity and for relative viable cell numbers and the level of infection was calculated as in Fig. 2B. The data shown are the average mean values obtained in an experiment performed with triplicate samples. (B) Cells harboring a resident MLV provirus, pCMMP-SEAP, encoding secreted alkaline phosphatase, were challenged with a second MLV vector, MMP-nls-lacZ[VSV-G] encoding β-galactosidase, in the presence of 100 mM chlorate. Chemiluminescent assays were then used to measure reporter enzyme activity levels (panel B), as well as relative viable cell numbers (panel C), and the values obtained with untreated cells was defined as 100% in each case. The data shown in panels C and D are the average mean values obtained in an experiment performed with quadruplicate samples. The data in panels A–C are representative of three independent experiments and error bars indicate the standard deviation of the data.
Figure 8
Figure 8. PAPSS activity affects transcription from the HIV-1 LTR.
(A) CHO-K1 or IM2 cells were challenged with either one of two VSV-G pseudotyped HIV-1 vectors, NL43E-R-Luc, that directs luciferase gene transcription from the viral LTR, or with pLenti6/V5-GW/LacZ, a self inactivating HIV-1 vector from which β-galactosidase expression is driven by an internal CMV promoter. Chemiluminescent assays were used to measure reporter enzyme activities and viable cell numbers. The data shown was calculated as in panel Fig. 2B and the value obtained with CHO-K1 cells was defined as 100% infection. (B) CHO-K1 cells were challenged with the viruses described in panel A, in the presence of either 100 mM chlorate, 5 mM Guaiacol or both inhibitors and subsequently assayed as in panel A. (C) Jurkat cells were spin inoculated with the VSV-G pseudotyped vectors NL43E-R-Luc[VSV-G] or MLV-LUC (an MLV vector that encodes luciferase) in the presence of 120 mM Chlorate, 5 mM guaiacol or both inhibitors. Chemiluminescent assays were used to monitor virus infection as in panel A. The viable cell number observed in the experiment shown in panel C is reported in panel D. For panels B–D the data are reported as the percentage of untreated controls. For panels A–D, the data is the average mean values obtained in an experiment with quadruplicate samples and are representative of three independent experiments. Error bars indicate the standard deviation of the data.

Similar articles

Cited by

References

    1. Goff SP. Host factors exploited by retroviruses. Nat Rev Microbiol. 2007;5:253–263. - PubMed
    1. Arhel N, Genovesio A, Kim KA, Miko S, Perret E, et al. Quantitative four-dimensional tracking of cytoplasmic and nuclear HIV-1 complexes. Nat Methods. 2006;3:817–824. - PubMed
    1. Bukrinskaya A, Brichacek B, Mann A, Stevenson M. Establishment of a functional human immunodeficiency virus type 1 (HIV-1) reverse transcription complex involves the cytoskeleton. J Exp Med. 1998;188:2113–2125. - PMC - PubMed
    1. Campbell EM, Nunez R, Hope TJ. Disruption of the actin cytoskeleton can complement the ability of Nef to enhance human immunodeficiency virus type 1 infectivity. J Virol. 2004;78:5745–5755. - PMC - PubMed
    1. Leung J, Yueh A, Appah FS, Jr, Yuan B, de los Santos K, et al. Interaction of Moloney murine leukemia virus matrix protein with IQGAP. Embo J. 2006;25:2155–2166. - PMC - PubMed

Publication types